Question: ) 3. Based on the following Life-Cycle S-Curve and internal conflict level, three possible reasons can contribute to the sudden increase in the slope of
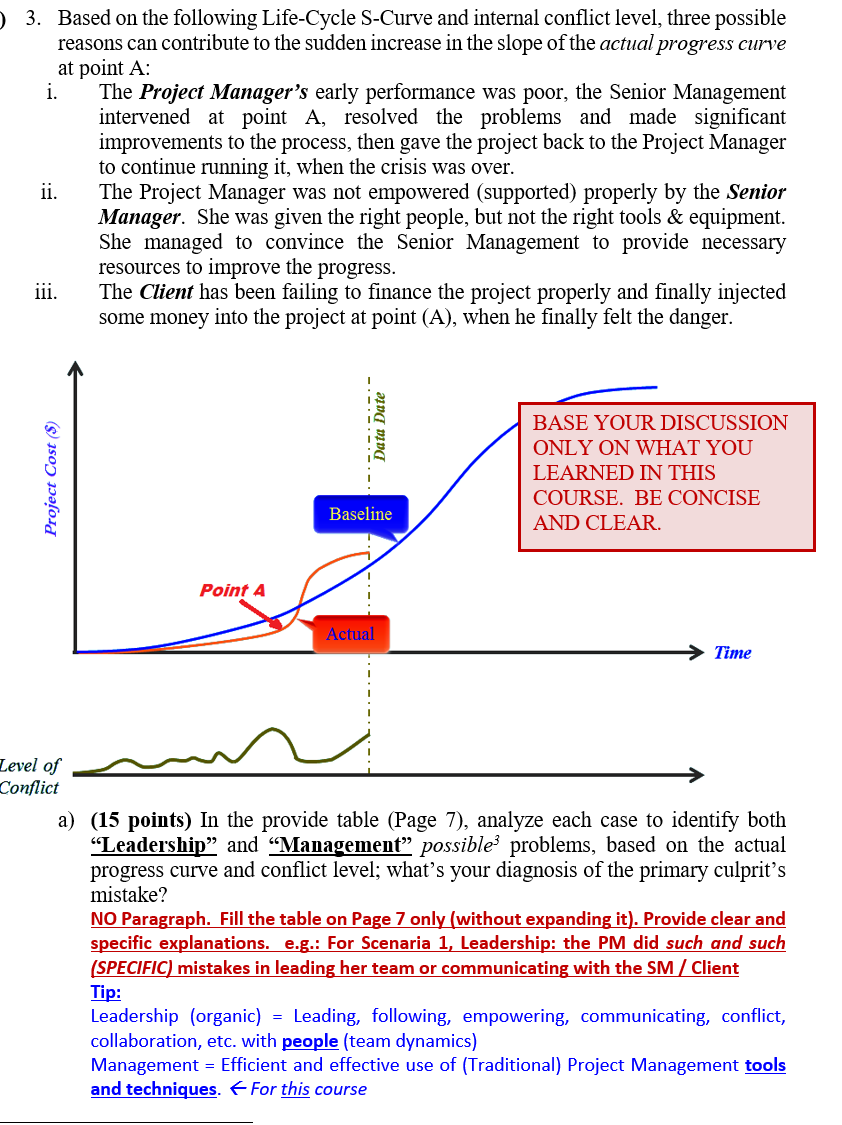

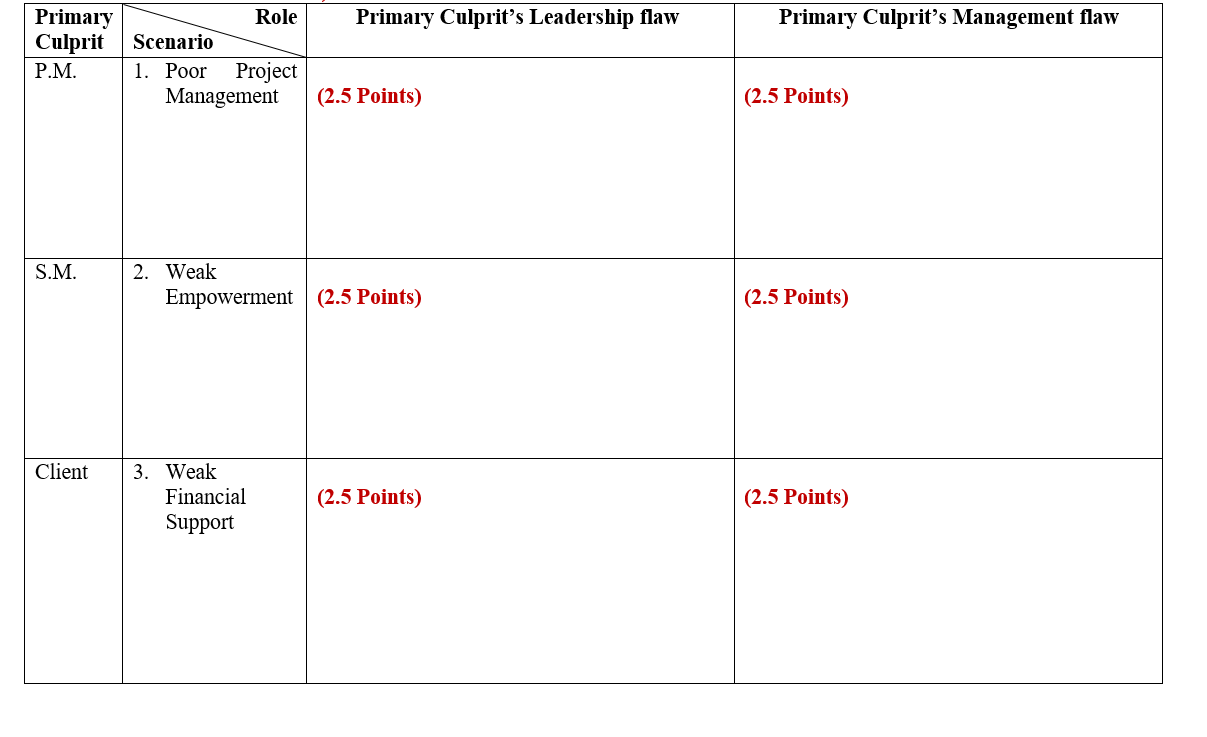
) 3. Based on the following Life-Cycle S-Curve and internal conflict level, three possible reasons can contribute to the sudden increase in the slope of the actual progress curve at point A: i. The Project Manager's early performance was poor, the Senior Management intervened at point A, resolved the problems and made significant improvements to the process, then gave the project back to the Project Manager to continue running it, when the crisis was over. ii. The Project Manager was not empowered (supported) properly by the Senior Manager. She was given the right people, but not the right tools & equipment. She managed to convince the Senior Management to provide necessary resources to improve the progress. The Client has been failing to finance the project properly and finally injected some money into the project at point (A), when he finally felt the danger. 111. Data Date Project Cost ($) BASE YOUR DISCUSSION ONLY ON WHAT YOU LEARNED IN THIS COURSE. BE CONCISE AND CLEAR. Baseline Point A Actual Time Level of Conflict a) (15 points) In the provide table (Page 7), analyze each case to identify both "Leadership and Management possible problems, based on the actual progress curve and conflict level; what's your diagnosis of the primary culprits mistake? NO Paragraph. Fill the table on Page 7 only (without expanding it). Provide clear and specific explanations. e.g.: For Scenaria 1, Leadership: the PM did such and such (SPECIFIC) mistakes in leading her team or communicating with the SM / Client Tip: Leadership (organic) = Leading, following, empowering, communicating, conflict, collaboration, etc. with people (team dynamics) Management = Efficient and effective use of (Traditional) Project Management tools and techniques. For this course b) (20 Points) For the Scenario #1 above (PM = Culprit): i. (10 points) Explain how you, as the SM, would be able to improve the situation - Tip: Change takes time & effort One Paragraph, 10 lines max. . (10 points) Show in the space provided on page 8, after deleting the current content, how the Cost-curve and the conflict level curve will look for the rest of the project for two different scenarios: a) Make no changes to the current fire-fighting" culture b) Make the improvements proposed in part (i) above Note : Provide clear annotations on the graph at key turning points and clearly show and annotate the end of the curve No paragraph here. Only show your forecast curves on the graph on page 8 and explain each critical point for each scenario, on the graph, using small sentences Tip: End of the graph will show how much the project deviated from plan. Budget overrun will be higher on the y-axis and time delay will be more to the left on the x-axis. Make rational and realistic assumptions. Pay attention to all previous notes and tips before drawing this graph. Side note: In real life, projects fail due to a combination of these and other) reasons. For this exercise, for simplicity, we are assuming only one party is at fault (PM, SM, or the client) and all other parties have been performing properly. Primary Culprit's Leadership flaw Primary Culprit's Management flaw Primary Culprit P.M. Role Scenario 1. Poor Project Management (2.5 Points) (2.5 Points) S.M. 2. Weak Empowerment (2.5 Points) (2.5 Points) Client 3. Weak Financial Support (2.5 Points) (2.5 Points)


