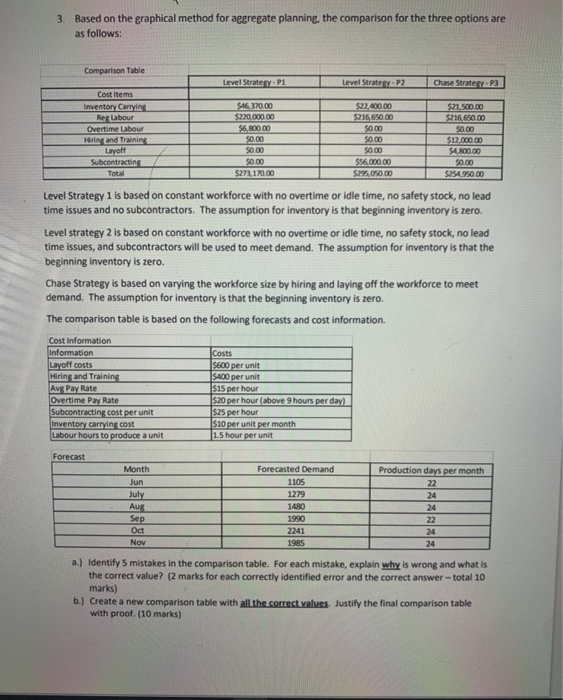
Question: 3. Based on the graphical method for aggregate planning, the comparison for the three options are as follows: Comparison Table Level Stratesy P1 Level Stratery.P2

3. Based on the graphical method for aggregate
3. Based on the graphical method for aggregate planning, the comparison for the three options are as follows: Comparison Table Level Stratesy P1 Level Stratery.P2 Chase Strate-23 Cost Items Inventory Carrying Rer Labour Overtime Labour Hiring and Training Layoff Subcontracting Total $46,370.00 $220,000.00 $6,800.00 $0.00 $0.00 $0.00 $273,170.00 $22.400.00 $216,650.00 $0.00 $0.00 $0.00 $56.000.00 $295,050.00 $21,500.00 $216,650.00 $0.00 $12,000.00 54,800.00 $0.00 $254.950.00 Level Strategy 1 is based on constant workforce with no overtime or idle time, no safety stock, no lead time issues and no subcontractors. The assumption for inventory is that beginning inventory is zero. Level strategy 2 is based on constant workforce with no overtime or idle time, no safety stock, no lead time issues, and subcontractors will be used to meet demand. The assumption for inventory is that the beginning inventory is zero. Chase Strategy is based on varying the workforce size by hiring and laying off the workforce to meet demand. The assumption for inventory is that the beginning inventory is zero. The comparison table is based on the following forecasts and cost information. Cost Information Information Layoff costs Hiring and Training Avg Pay Rate Overtime Pay Rate Subcontracting cost per unit Inventory carrying cost Labour hours to produce a unit Costs $600 per unit S400 per unit $15 per hour $20 per hour (above 9 hours per day) $25 per hour $10 per unit per month 1.5 hour per unit Forecast Month Jun July Aug Sep Oct Nov Forecasted Demand 1105 1279 1480 1990 2241 1985 Production days per month 22 24 24 22 24 a.) Identify 5 mistakes in the comparison table. For each mistake, explain why is wrong and what is the correct value? (2 marks for each correctly identified error and the correct answer total 10 marks) b.) Create a new comparison table with all the correct values Justify the final comparison table with proof. (10 marks)

Step by Step Solution

There are 3 Steps involved in it

1 Expert Approved Answer
Step: 1 Unlock blur-text-image
Question Has Been Solved by an Expert!

Get step-by-step solutions from verified subject matter experts

Step: 2 Unlock
Step: 3 Unlock

Students Have Also Explored These Related General Management Questions!