

Question: - T T Vie 126% v Zoom # ii Insert Table Do Collaborate Add Category Chart Text Shape Medis Comment Format Organize + Chase strategy
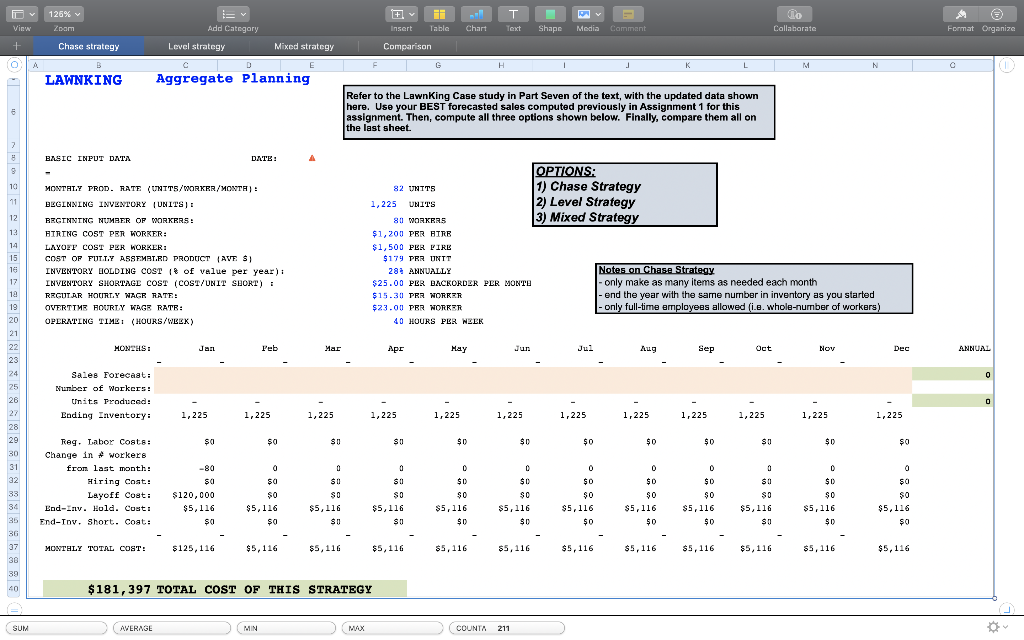
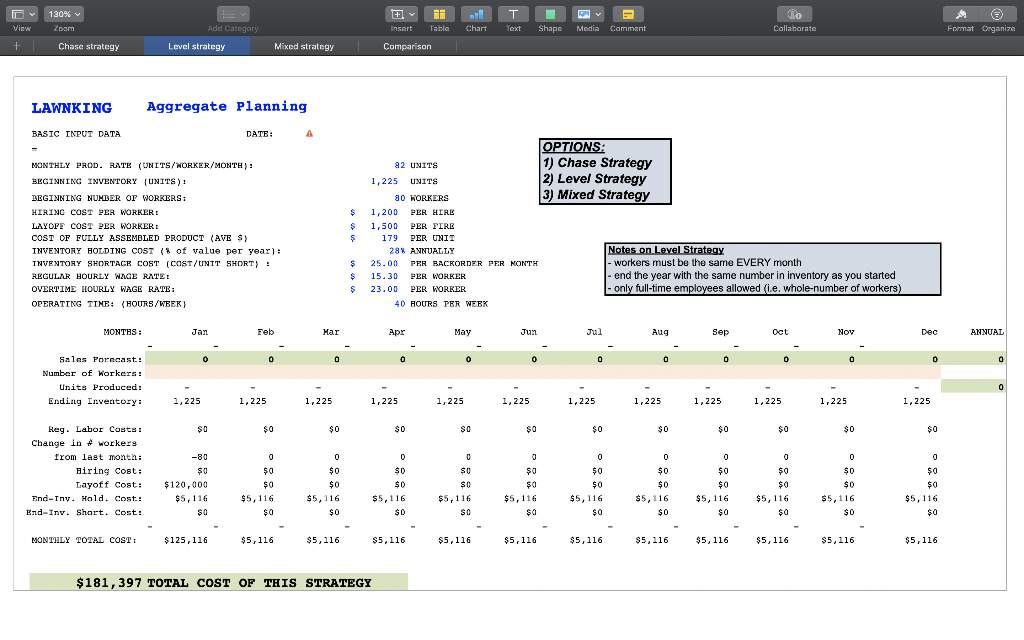
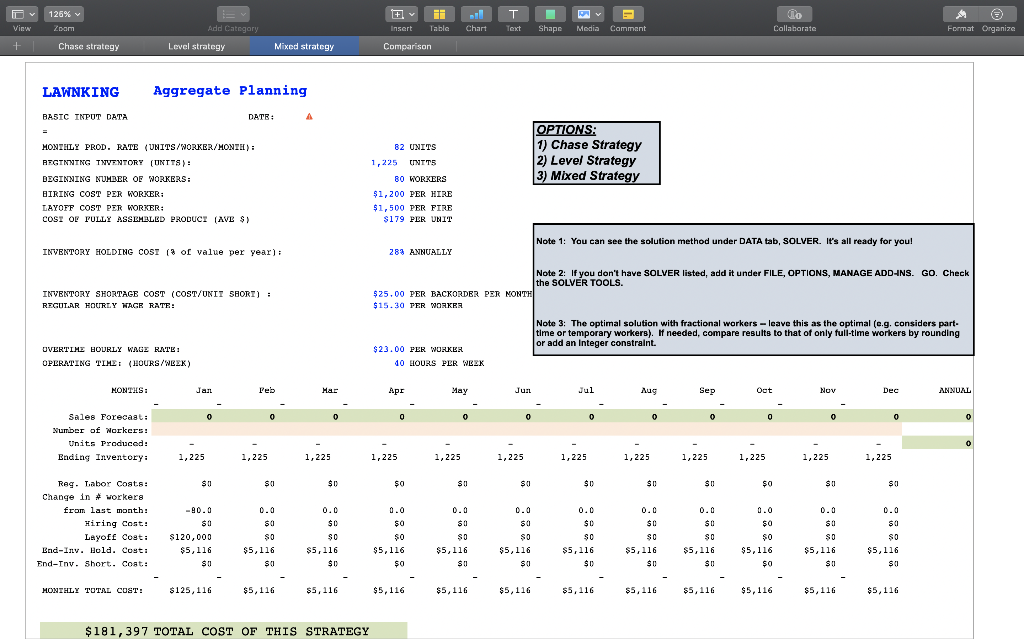
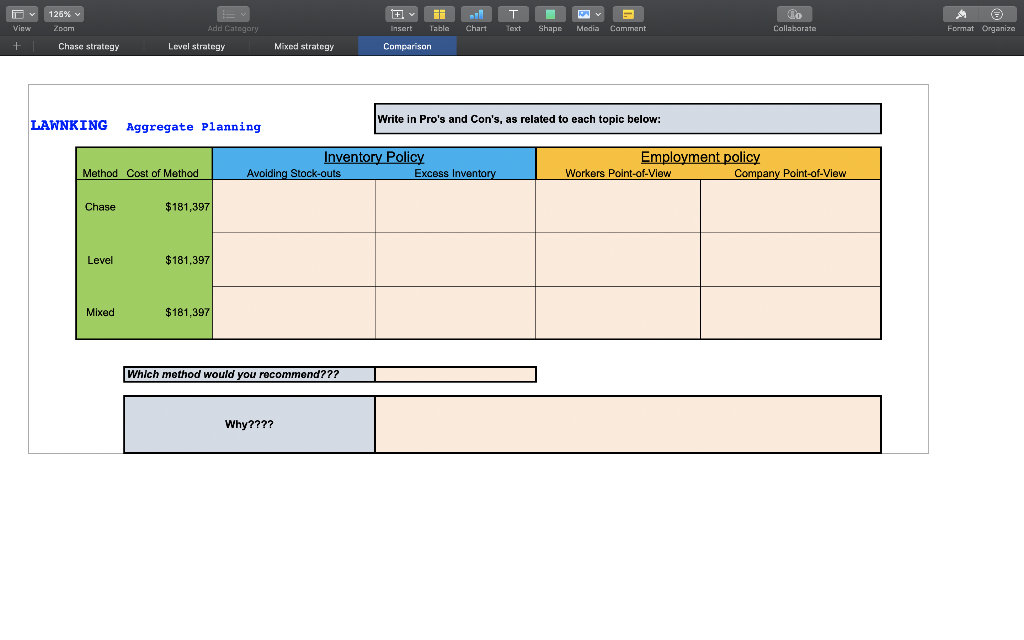
- T T Vie 126% v Zoom # ii Insert Table Do Collaborate Add Category Chart Text Shape Medis Comment Format Organize + Chase strategy Level strategy Mixed strategy Comparison o A G H M 0 LAWNKING D Aggregate Planning Refer to the LawnKing Case study in Part Seven of the text, with the updated data shown here. Use your BEST forecasted sales computed previously in Assignment 1 for this assignment. Then, compute all three options shown below. Finally, compare them all on the last sheet. BASIC INPUT DATA DATE: 8 10 11 12 13 14 OPTIONS: 82 UNITS 1) Chase Strategy 1,225 UNITS 2) Level Strategy 801 WORKERS 3) Mixed Strategy $1,200 PER RTRE $1,500 PER PIRE $179 PRR UNIT 289 ANNUALLY Notes on Chase Strategy $25.00 PER BACKORDER PER MONTH -only make as many items as needed each month $15.30 PRR NORRER - end the year with the same number in inventory as you started $23.00 PER WORKER - only full-time employees allowed (i.e. whole-number of workers) 40 HOURS PER WEEK MONTALY PROD. RATE (UNITS/WORKER/MONTH) BEGINNING INVENTORY UNITS BEGINNING NUMBER OF WORKERS: HIRING COST PER WORKER: LAYOFF COST PER WORKER: COST OF FULLY ASSEMBLED PRODUCT (AVE $1 INVENTORY BIOLDING COST 18 of value per year): INVENTORY SHORTAGE COST (COST/UNIT SHORT) REGULAR HOURTY WAGE RATE: OVERTIME HOURLY WAGE RATE: OPERATING TIME (HOURS/WEEK) 15 15 17 1a 19 20 21 MONTHS: Ja Peb Mar Apr Hay Jul Aug Sep Oct Nov 22 23 Dec ANNUAL 24 0 0 25 26 Sales Forecasti Number of Workers Units Produced: Ending Inventory: 0 27 1, 225 1, 225 1,225 1, 225 1,225 1,225 1,225 1, 225 1,225 1, 225 1,225 1, 225 28 29 $0 $0 SII SO $0 $0 $0 $0 $0 SO $0 $0 30 31 -80 D Teg. Labor Costs: Change in #workers from last month: Hiring Cost: Layoff Cost: Eod-Zav. Hold. Cost: End-Inv. short. Coat: 0 $0 32 $0 $0 33 34 35 36 $0 $120,000 $5,116 so 0 sa $0 $5,116 $0 0 $0 SO $5,116 s! 0 $0 $0 $5,116 $0 $0 $5,116 $0 0 $0 $0 $5,116 $0 0 $0 $0 $5,116 $0 0 $0 $0 $5,116 $0 0 $0 $0 $5,116 $0 SO $5,116 s! $5,116 SD 0 $0 $0 $5,116 so MONTHLY TOTAL COST: $125, 116 $5,116 $5,116 $5,116 $5, 116 $5,116 $5, 116 $5, 116 $5, 116 $5,116 $5, 116 $5, 116 37 30 39 40 $ 181,397 TOTAL COST OF THIS STRATEGY SUM AVERAGE (MIN MAX COUNTA 211 T Tv 100% v View Zoom + Chase strategy do Collaborate Add Category Insert Table Chart Text Shape Media Comment Format Organize Level strategy Mixed strategy Comparison LAWNKING Aggregate Planning BASIC INPUT DATA DATE: MONTHLY PROD. RATE (UNITS/WORKER/MONTH) : BEGINNING INVENTORY (UNITS) $ $ $ BEGINNING NUMBER OF WORKERS: HIRING COST PER WORKER LAYOFF COST PER WORKER COST OF FULLY ASSEMBLED PRODUCT (AVE $ INVENTORY HOLDING COST (% of value per year]: INVENTORY SHORTAGE COST (COST/UNIT SHORT) : REGULAR HOURLY WAGE RATE! OVERTIME HOURLY WAGE RATE : OPERATING TIME: (HOURS/WEEK) OPTIONS: 82 UNITS 1) Chase Strategy 1,225 UNITS 2) Level Strategy 0 KORKERS 3) Mixed Strategy 1,200 PER HIRE 1,500 PER FIRE 179 PER UNIT 28% ANNUALLY % Notes on Level Strategy 25.00 PER BACKORDER PER MONTH - workers must be the same EVERY month 15.30 PER WORKER - end the year with the same number in inventory as you started 23.00 PER WORKER - only full-time employees allowed (i.e. whole-number of workers) 40 HOURS PER WEEK $ $ s $ $ MONTHS: Jan Feb Har Apr May Jun Aug Sep Oct Nov Dec ANNUAL 0 0 0 0 0 0 0 0 0 0 0 0 0 0 Sales Forecast: Number of Workers: Units Produced: Ending Inventory: 0 1, 225 1 1,225 1,225 1,225 1, 225 1, 225 1,225 1,225 1,225 1,225 1,225 1,225 $0 $0 $0 $0 SO $0 $0 $0 $0 $0 $0 $0 0 0 0 0 Reg. Labor Costs: Change in workers from last month: Hiring Cost: Layoff Cost: End-Iny. Hold. Cost: End-Inv. Short. Cost: -80 $0 $120,000 $5,116 $a $0 $0 $5, 116 $0 $0 $0 $5, 116 $0 0 0 SO $0 $5,116 $0 0 SO SO $5,116 SO o so $ $0 $5,116 $a 0 $ $0 $0 $5, 116 $0 0 $0 $0 $5, 116 $0 $0 $0 $5, 116 $0 $0 $0 $5,116 $a 0 $0 $0 $5,116 $0 0 $0 $0 $5, 116 $0 MONTHLY TOTAL COST $125, 116 $5,116 $5,116 $5, 116 $5,116 $5,116 $5,116 $5,116 $5, 116 $5 $5,116 $ $5,116 $5,116 $181,397 TOTAL COST OF THIS STRATEGY T View 126% Zoom + Insert T Text Do Collaborate @ Format Organiza Add Category Table Chart Shape Media Comment Chase strategy Level strategy Mixed strategy Comparison LAWNKING Aggregate Planning BASIC INPUT DATA DATE: A 82 UNITS MONTHLY PROD. RATE (UNITS/WORKER/MONIE): BEGINNTNG TNVENTORY (UNTTS): OPTIONS: 1) Chase Strategy 2) Level Strategy 3) Mixed Strategy BEGINNING NUMBER OF WORKERS: BIRING COST PER WORKER: LAYOFF COST PER WORKER: COST OF PULLY ASSEMBLED PRODUCE (AVE S) 1,225 UNITS 80 WORKERS $1,200 PER HIRE $1,500 PER FIRE $ $179 PER UNIT Note 1: You can see the solution method under DATA tab, SOLVER. It's all ready for you! INVENTORY HOLDING COST (% of value per year); 289 ANNUALLY INVENTORY SHORTAGE COST (COST/UNIT SHORI) : REGULAR HOURLY WAGE RATE: Note 2: If you don't have SOLVER listed, add it under FILE, OPTIONS, MANAGE ADD-INS. GO. Check the SOLVER TOOLS $25.00 PER BACKORDER PER MONTH $ $15.30 PER WORKEA Note 3: The optimal solution with fractional workers - leave this as the optimal (e.g. considers part- time or temporary workers). If needed, compare results to that of only full-time workers by rounding or add an Integer constraint. $23.00 PER WORKER 10 HOURS PER WEEK OVERTIME HOURLY WAGE RATE: OPERATING TIME (HOURS/WEEK) MONTHS: Jall Peb Apr May Jual Aug Sep Oot Nov Dec ANNUAL . O 0 0 0 o 0 o 0 0 0 0 Sales Forecast: Number of Workers: Units Produced: Ending Inventory 0 - 1,225 1,225 1,225 1, 225 1, 225 1,225 1, 225 1,225 1,225 1,225 1,225 1,225 SOI SI $0 $0 SO su $0 SO $ $0 SO $ $0 0.0 Reg. Tabor Coats: Change in workers from last month: Hiring Cost: Layoff Costi Bad-Inv. Hold. Costi End-Tny. Short. Coat: 0.0 0 0.0 $0 0.0 $0 0.0 $0 0.0 SO SU -90.0 $0 $120,000 $5,116 SO SO $5,116 SO 0.0 $ 0 $0 $5,116 $0 $0 $5,116 $0 SO $5,116 SO 0.0 $a so $5,116 su $0 $5,116 $0 SO $5,116 $1 0.0 $0 SO $5,116 $ 0.0 $0 $0 $5,116 $0 SO $5,116 $! 0.0 SO $0 $5,116 $0 MONTHLY TOTAL COST: $125, 116 $5,116 $5, 116 $5,116 $5,116 $5,116 $5, 116 $5,116 $5,116 $5,116 $5,116 $5,116 $181,397 TOTAL COST OF THIS STRATEGY T T View 126% v Zoom do Callaborate Add Category Insert Table Chart Text Shape Media Comment Format Organize + Chase strategy Level strategy Mixed strategy Comparison Write in Pro's and Con's, as related to each topic below: LAWNKING Aggregate Planning Inventory Policy Employment policy Method Cost of Method Avoiding Stock-outs Excess Inventory Workers Point-of-View Company Point-of-View Chase $181,397 Level $181.397 Mixed $181.397 Which method would you recommend??? Why
Step by Step Solution
There are 3 Steps involved in it
1 Expert Approved Answer
Step: 1 Unlock

Question Has Been Solved by an Expert!
Get step-by-step solutions from verified subject matter experts
Step: 2 Unlock
Step: 3 Unlock