

Question: 3 Connect Assignment i Saved Help Save & Exit Check my wo Two different forecasting techniques ( F 1 and F 2 ) were used
Connect Assignment i
Saved
Help
Save & Exit
Check my wo
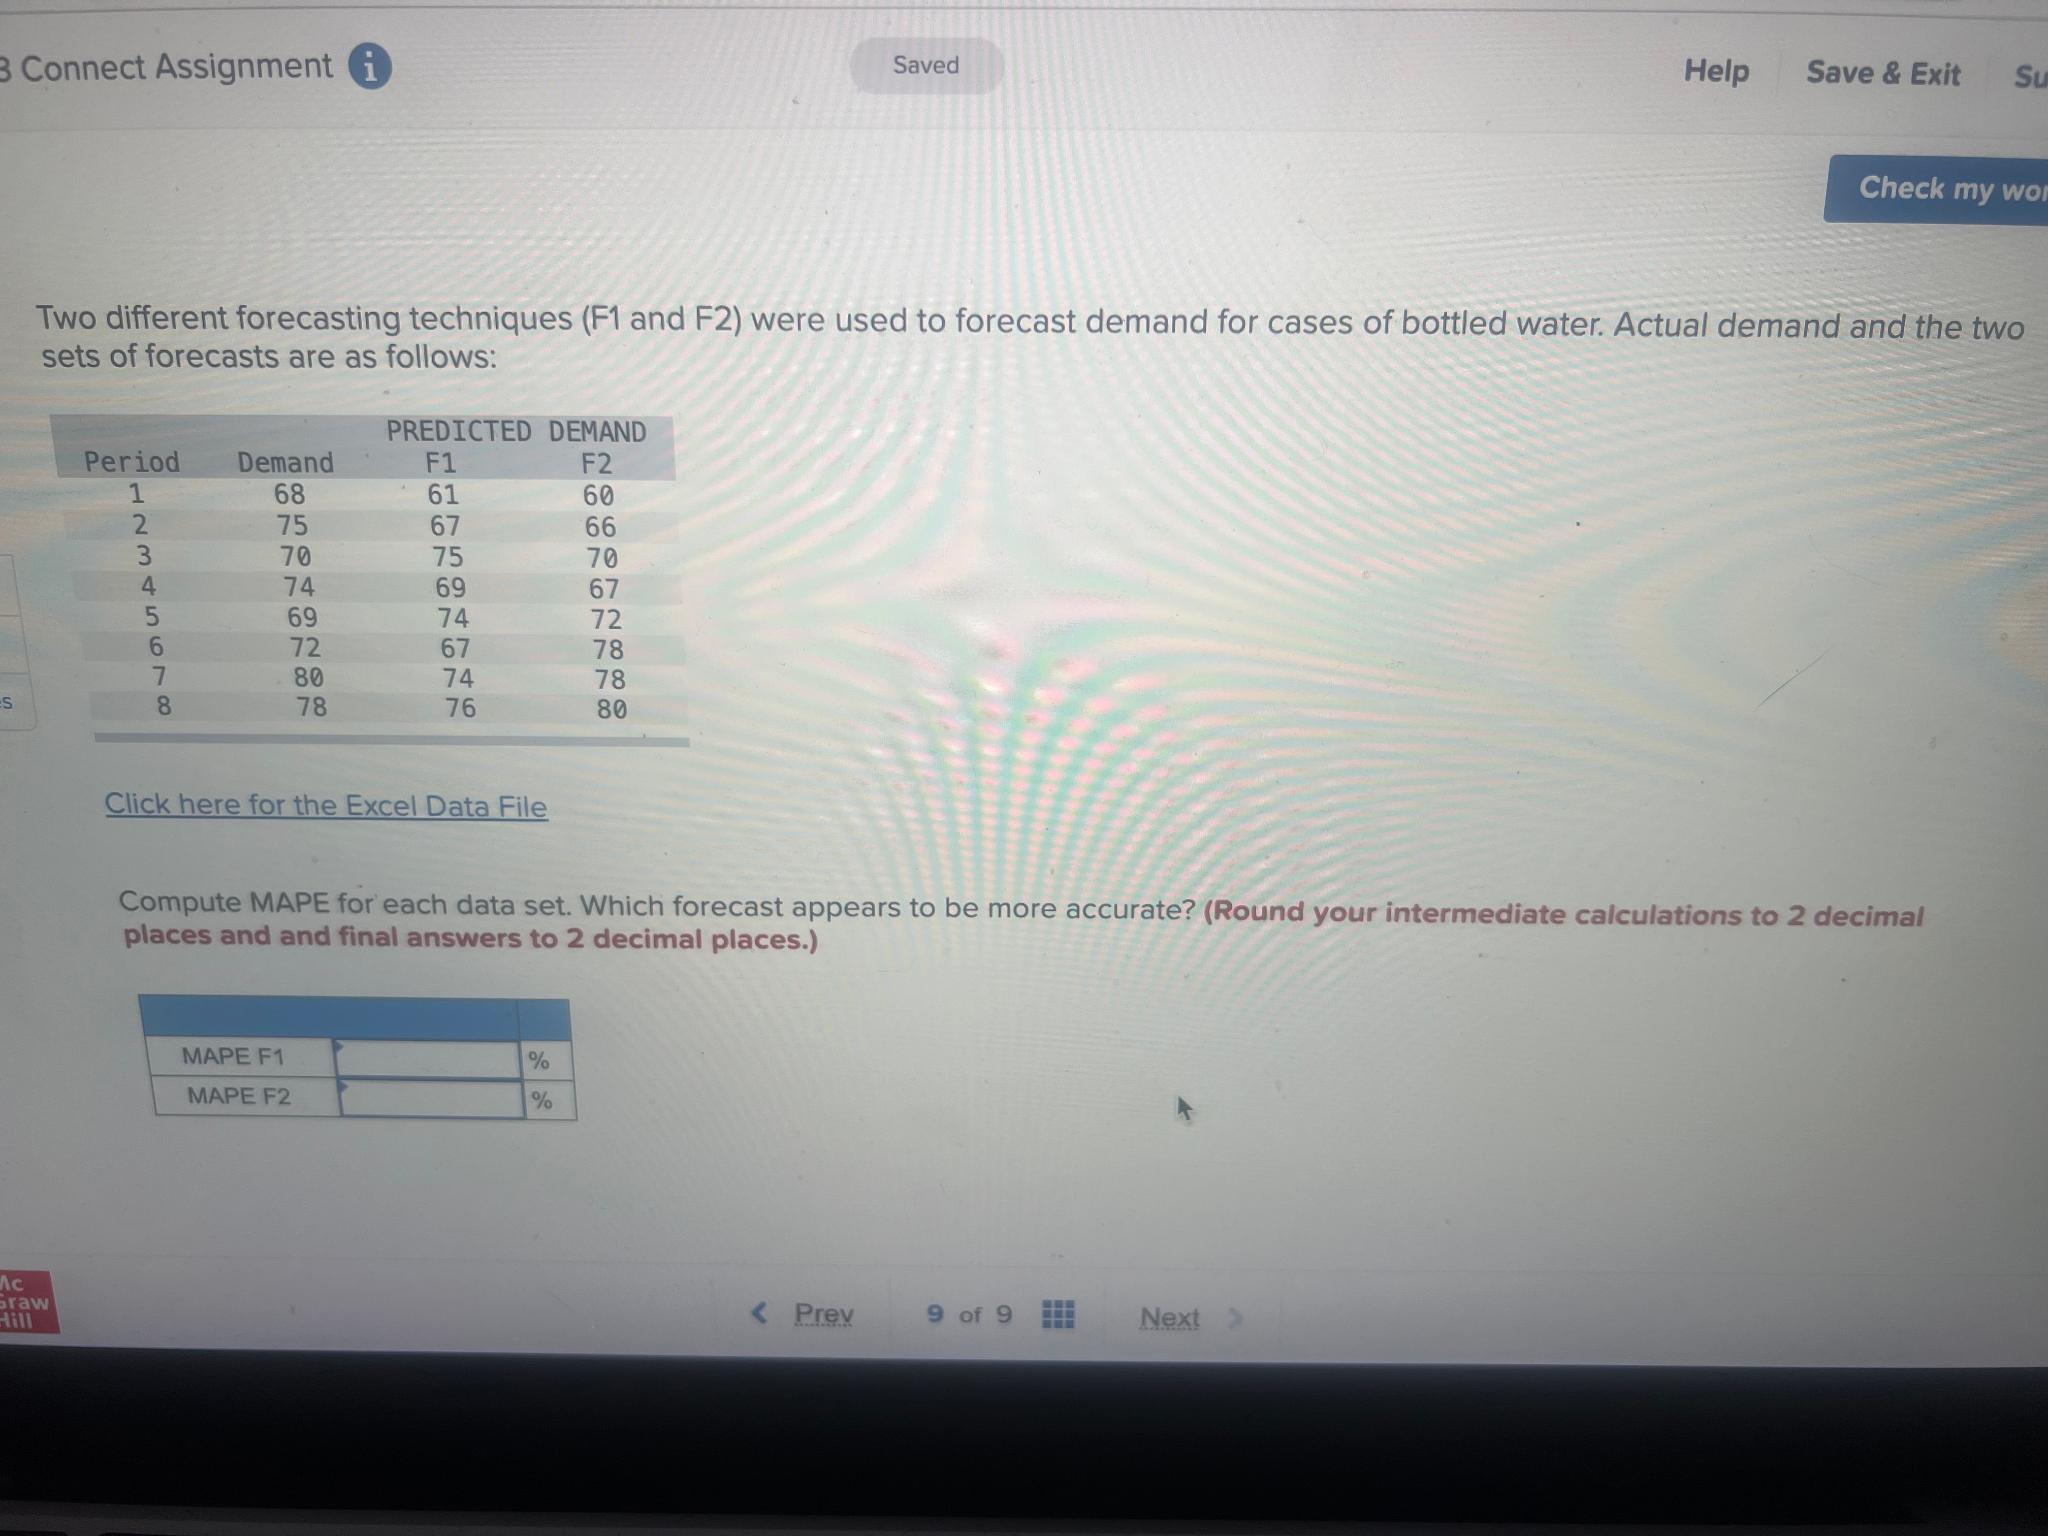
Two different forecasting techniques F and F were used to forecast demand for cases of bottled water. Actual demand and the two sets of forecasts are as follows:
tablePREDICTEDPeriodDemand,FF
Click here for the Excel Data File
Compute MAPE for each data set. Which forecast appears to be more accurate? Round your intermediate calculations to decimal places and and final answers to decimal places.
tableMAPE F
Step by Step Solution
There are 3 Steps involved in it
1 Expert Approved Answer
Step: 1 Unlock

Question Has Been Solved by an Expert!
Get step-by-step solutions from verified subject matter experts
Step: 2 Unlock
Step: 3 Unlock