

Question: 3. Consider the causal LTI system block diagram shown below. Note: it is the same as the system in Problem 3 , but with a
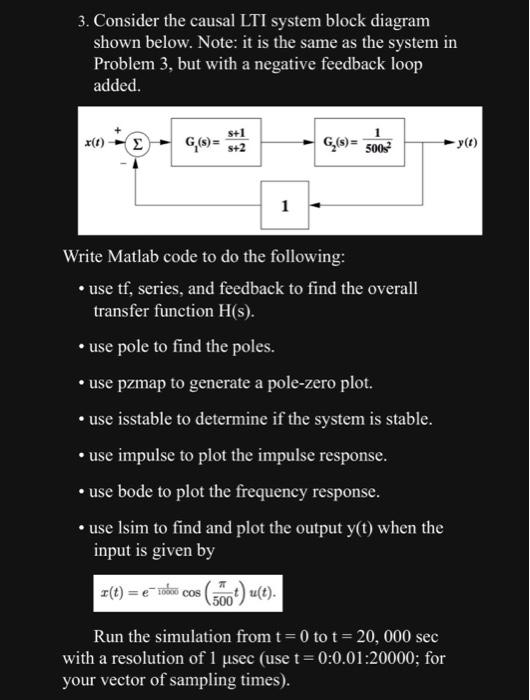
3. Consider the causal LTI system block diagram shown below. Note: it is the same as the system in Problem 3 , but with a negative feedback loop added. Write Matlab code to do the following: - use tf, series, and feedback to find the overall transfer function H(s). - use pole to find the poles. - use pzmap to generate a pole-zero plot. - use isstable to determine if the system is stable. - use impulse to plot the impulse response. - use bode to plot the frequency response. - use Isim to find and plot the output y(t) when the input is given by x(t)=e10000tcos(500t)u(t). Run the simulation from t=0 to t=20,000sec with a resolution of 1sec (use t=0:0.01:20000; for your vector of sampling times)
Step by Step Solution
There are 3 Steps involved in it

Get step-by-step solutions from verified subject matter experts