

Question: 3) Consider the following regression output, from relating the amount of time people spend watching TV in a day and their cholesterol levels. a) Draw
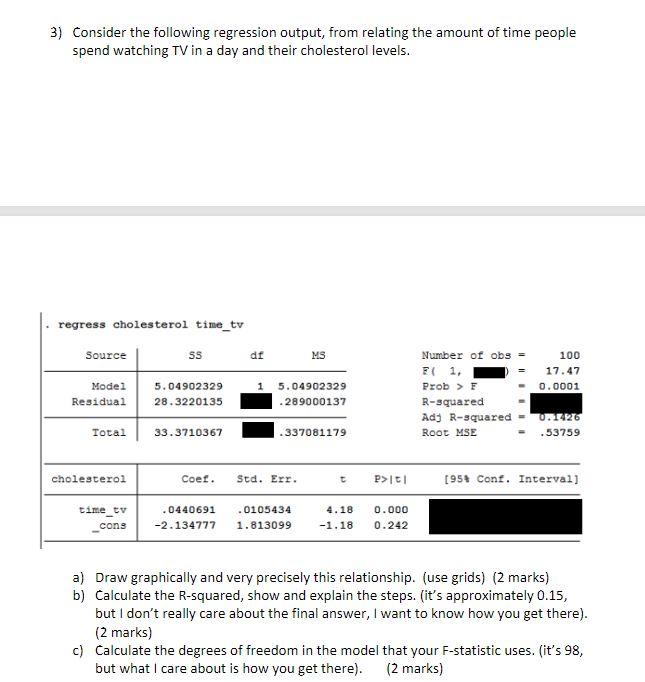
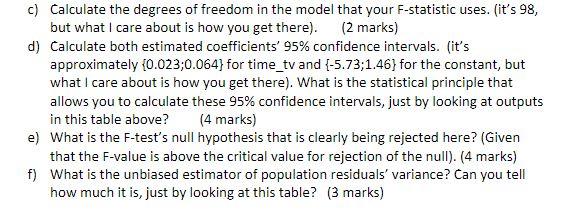
3) Consider the following regression output, from relating the amount of time people spend watching TV in a day and their cholesterol levels. a) Draw graphically and very precisely this relationship. (use grids) (2 marks) b) Calculate the R-squared, show and explain the steps. (it's approximately 0.15, but I don't really care about the final answer, I want to know how you get there). ( 2 marks) c) Calculate the degrees of freedom in the model that your F-statistic uses. (it's 98 , but what I care about is how you get there). (2 marks) c) Calculate the degrees of freedom in the model that your F-statistic uses. (it's 98 , but what I care about is how you get there). (2 marks) d) Calculate both estimated coefficients' 95% confidence intervals. (it's approximately {0.023;0.064} for time_tv and {5.73;1.46} for the constant, but what I care about is how you get there). What is the statistical principle that allows you to calculate these 95% confidence intervals, just by looking at outputs in this table above? (4 marks) e) What is the F-test's null hypothesis that is clearly being rejected here? (Given that the F-value is above the critical value for rejection of the null). (4 marks) f) What is the unbiased estimator of population residuals' variance? Can you tell how much it is, just by looking at this table? ( 3 marks)
Step by Step Solution
There are 3 Steps involved in it

Get step-by-step solutions from verified subject matter experts