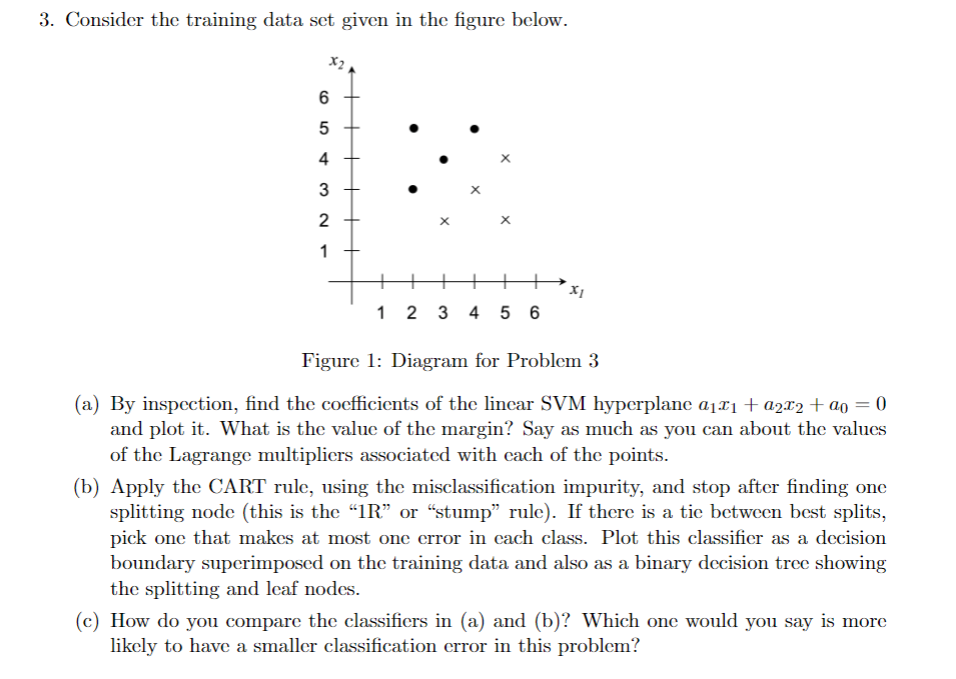
Question: 3. Consider the training data set given in the figure below. X2 6 A X 3 X 2 X X * X1 1 2 3

3. Consider the training data set given in the
3. Consider the training data set given in the figure below. X2 6 A X 3 X 2 X X * X1 1 2 3 4 5 6 Figure 1: Diagram for Problem 3 (a) By inspection, find the coefficients of the linear SVM hyperplane all + a212 + do = 0 and plot it. What is the value of the margin? Say as much as you can about the values of the Lagrange multipliers associated with each of the points. (b) Apply the CART rule, using the misclassification impurity, and stop after finding one splitting node (this is the "IR" or "stump" rule). If there is a tie between best splits, pick one that makes at most one error in each class. Plot this classifier as a decision boundary superimposed on the training data and also as a binary decision tree showing the splitting and leaf nodes. (c) How do you compare the classifiers in (a) and (b)? Which one would you say is more likely to have a smaller classification error in this

Step by Step Solution

There are 3 Steps involved in it

1 Expert Approved Answer
Step: 1 Unlock blur-text-image
Question Has Been Solved by an Expert!

Get step-by-step solutions from verified subject matter experts

Step: 2 Unlock
Step: 3 Unlock

Students Have Also Explored These Related Mathematics Questions!