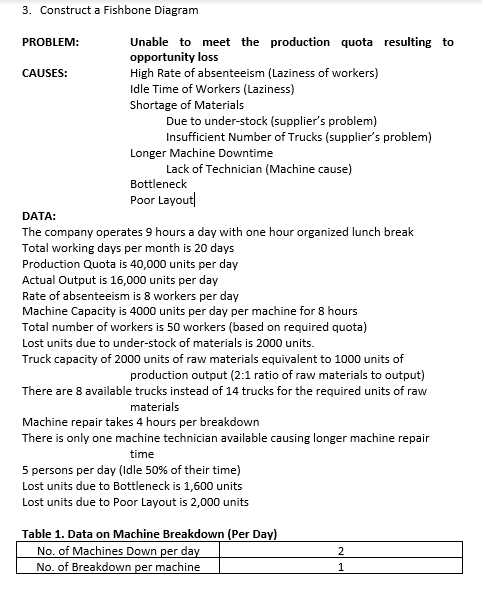
Question: 3. Construct a Fishbone Diagram PROBLEM: CAUSES: Unable to meet the production quota resulting to opportunity loss High Rate of absenteeism (Laziness of workers) Idle

3. Construct a Fishbone Diagram PROBLEM: CAUSES:

3. Construct a Fishbone Diagram PROBLEM: CAUSES: Unable to meet the production quota resulting to opportunity loss High Rate of absenteeism (Laziness of workers) Idle Time of Workers (Laziness) Shortage of Materials Due to under-stock (supplier's problem) Insufficient Number of Trucks (supplier's problem) Longer Machine Downtime Lack of Technician (Machine cause) Bottleneck Poor Layout DATA: The company operates 9 hours a day with one hour organized lunch break Total working days per month is 20 days Production Quota is 40,000 units per day Actual Output is 16,000 units per day Rate of absenteeism is 8 workers per day Machine Capacity is 4000 units per day per machine for 8 hours Total number of workers is 50 workers (based on required quota) Lost units due to under-stock of materials is 2000 units. Truck capacity of 2000 units of raw materials equivalent to 1000 units of production output (2:1 ratio of raw materials to output) There are 8 available trucks instead of 14 trucks for the required units of raw materials Machine repair takes 4 hours per breakdown There is only one machine technician available causing longer machine repair time 5 persons per day (Idle 50% of their time) Lost units due to Bottleneck is 1,600 units Lost units due to poor Layout is 2,000 units Table 1. Data on Machine Breakdown (Per Day) No. of Machines Down per day No. of Breakdown per machine 2 1

Step by Step Solution

There are 3 Steps involved in it

1 Expert Approved Answer
Step: 1 Unlock blur-text-image
Question Has Been Solved by an Expert!

Get step-by-step solutions from verified subject matter experts

Step: 2 Unlock
Step: 3 Unlock

Students Have Also Explored These Related General Management Questions!