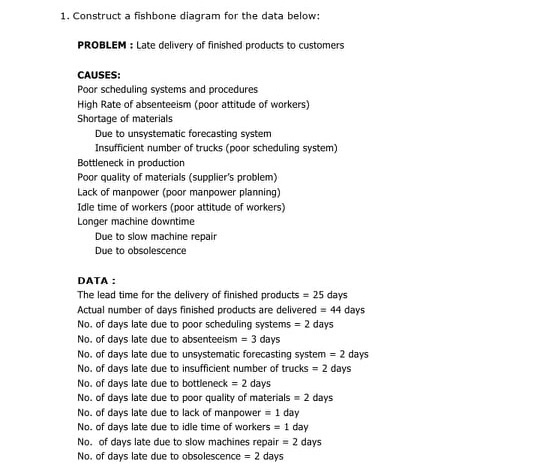
Question: 1. Construct a fishbone diagram for the data below: PROBLEM : Late delivery of finished products to customers CAUSES: Poor scheduling systems and procedures High

1. Construct a fishbone diagram for the data
1. Construct a fishbone diagram for the data below: PROBLEM : Late delivery of finished products to customers CAUSES: Poor scheduling systems and procedures High Rate of absenteeism (poor attitude of workers) Shortage of materials Due to unsystematic forecasting system Insufficient number of trucks (poor scheduling system) Bottleneck in production Poor quality of materials (supplier's problem) Lack of manpower (poor manpower planning) Idle time of workers (poor attitude of workers) Longer machine downtime Due to slow machine repair Due to obsolescence DATA: The lead time for the delivery of finished products = 25 days Actual number of days finished products are delivered = 44 days No. of days late due to poor scheduling systems = 2 days No. of days late due to absenteeism = 3 days No. of days late due to unsystematic forecasting system = 2 days No. of days late due to insufficient number of trucks = 2 days No. of days late due to bottleneck = 2 days No. of days late due to poor quality of materials = 2 days No. of days late due to lack of manpower = 1 day No. of days late due to idle time of workers = 1 day No. of days late due to slow machines repair = 2 days No. of days late due to obsolescence = 2 days

Step by Step Solution

There are 3 Steps involved in it

1 Expert Approved Answer
Step: 1 Unlock blur-text-image
Question Has Been Solved by an Expert!

Get step-by-step solutions from verified subject matter experts

Step: 2 Unlock
Step: 3 Unlock

Students Have Also Explored These Related General Management Questions!