

Question: 3. Create the printout for testing whether the mean high price of all NYSE stocks differs from the mean high price of all NASDAQ stocks
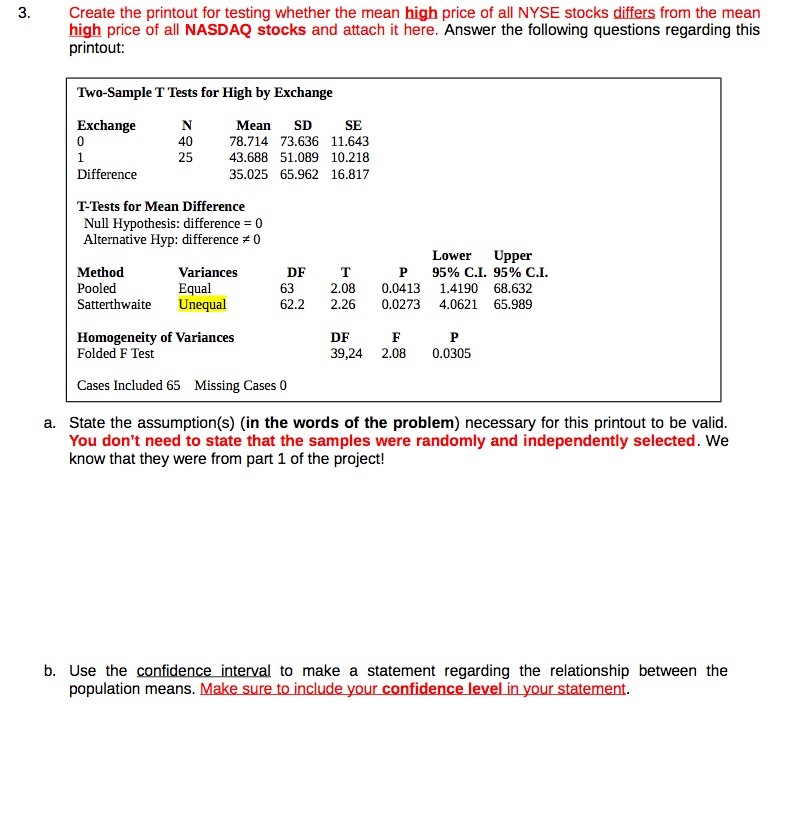
3. Create the printout for testing whether the mean high price of all NYSE stocks differs from the mean high price of all NASDAQ stocks and attach it here. Answer the following questions regarding this printout: Two-Sample T Tests for High by Exchange Exchange Mean SD SE 0 78.714 73.636 11.643 1 25 43.688 51.089 10.218 Difference 35.025 65.962 16.817 T-Tests for Mean Difference Null Hypothesis: difference = 0 Alternative Hyp: difference = 0 Lower Upper Method Variances DF T P 95% C.I. 95% C.I. Pooled Equal 63 2.08 0.0413 1.4190 68.632 Satterthwaite Unequal 62.2 2.26 0.0273 4.0621 65.989 Homogeneity of Variances DF F Folded F Test 39,24 2.08 0.0305 Cases Included 65 Missing Cases 0 a. State the assumption(s) (in the words of the problem) necessary for this printout to be valid. You don't need to state that the samples were randomly and independently selected. We know that they were from part 1 of the project! b. Use the confidence interval to make a statement regarding the relationship between the population means. Make sure to include your confidence level in your statement
Step by Step Solution
There are 3 Steps involved in it

Get step-by-step solutions from verified subject matter experts