

Question: 3. Determine whether each model is best represented as a linear, quadratic or exponential regression. a) y = 23(1 1) b) y = 7x(x -10)
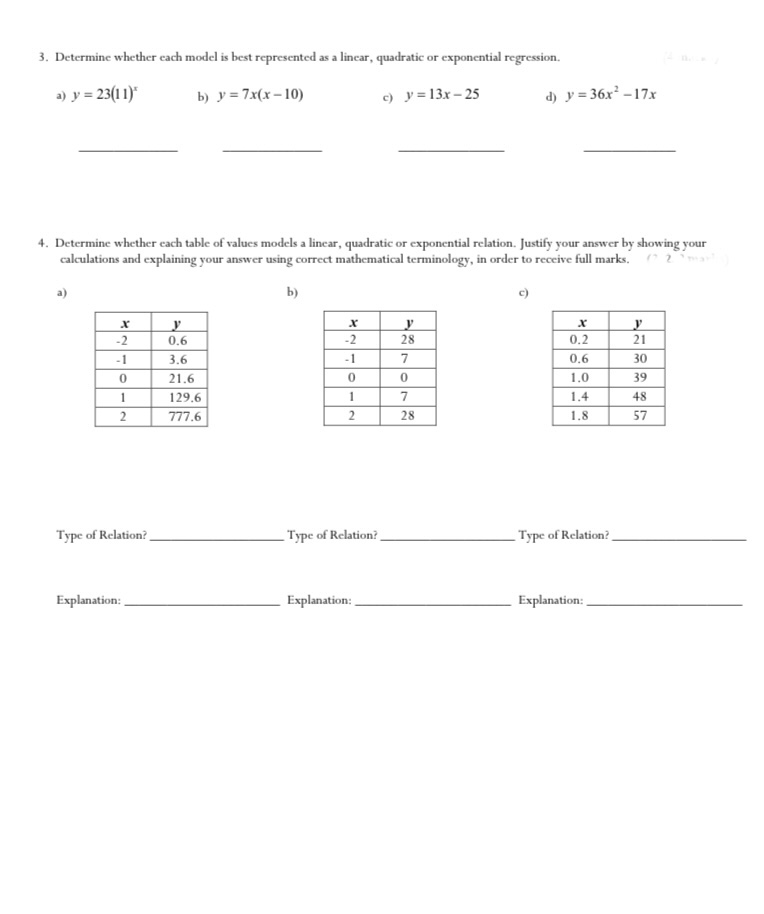
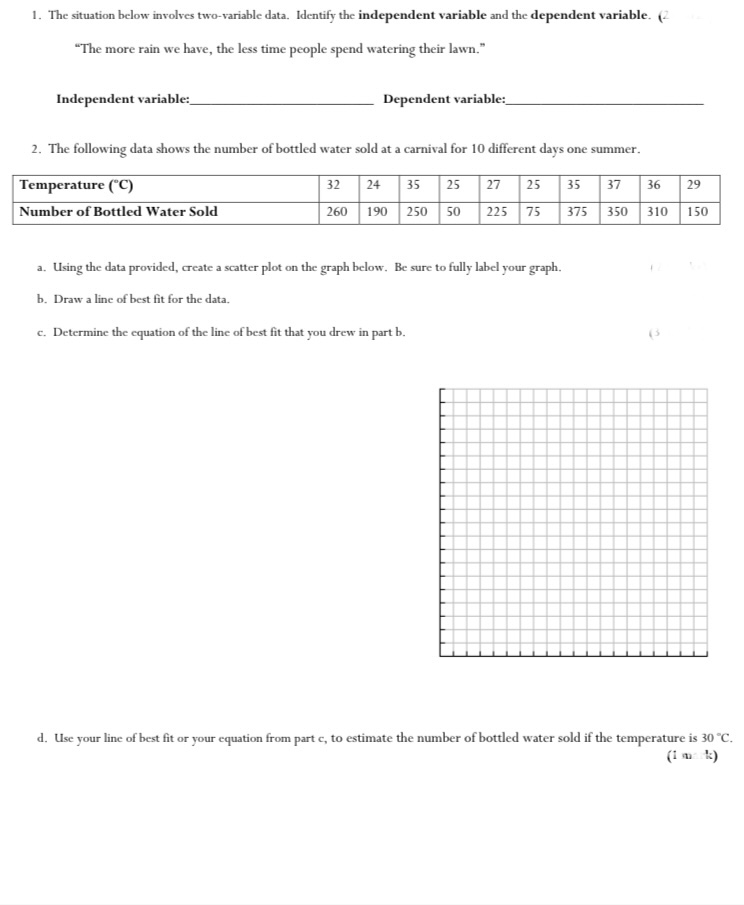
3. Determine whether each model is best represented as a linear, quadratic or exponential regression. a) y = 23(1 1)" b) y = 7x(x -10) c) y =13x - 25 d) y = 36x3 -17x 4. Determine whether each table of values models a linear, quadratic or exponential relation. Justify your answer by showing your calculations and explaining your answer using correct mathematical terminology, in order to receive full marks. b) c) X y X y X y -2 0.6 -2 28 0.2 21 -1 3.6 -1 7 0.6 30 0 21.6 0 0 1.0 39 1 129.6 1 7 1.4 48 2 777.6 2 28 1.8 57 Type of Relation? Type of Relation? Type of Relation? Explanation: Explanation: Explanation:1. The situation below involves two-variable data. Identify the independent variable and the dependent variable. (2 "The more rain we have, the less time people spend watering their lawn." Independent variable:_ Dependent variable: 2. The following data shows the number of bottled water sold at a carnival for 10 different days one summer. Temperature (C) 32 24 35 25 27 25 35 37 36 29 Number of Bottled Water Sold 260 190 250 50 225 75 375 350 310 150 a. Using the data provided, create a scatter plot on the graph below. Be sure to fully label your graph. b. Draw a line of best fit for the data. c. Determine the equation of the line of best fit that you drew in part b. 13 d. Use your line of best fit or your equation from part c, to estimate the number of bottled water sold if the temperature is 30 "C. (1 m k)
Step by Step Solution
There are 3 Steps involved in it

Get step-by-step solutions from verified subject matter experts