

Question: # 3 Develop two forecast models for the AmTrk ridership data ( as shown on next slide ) : first the linear model A ,
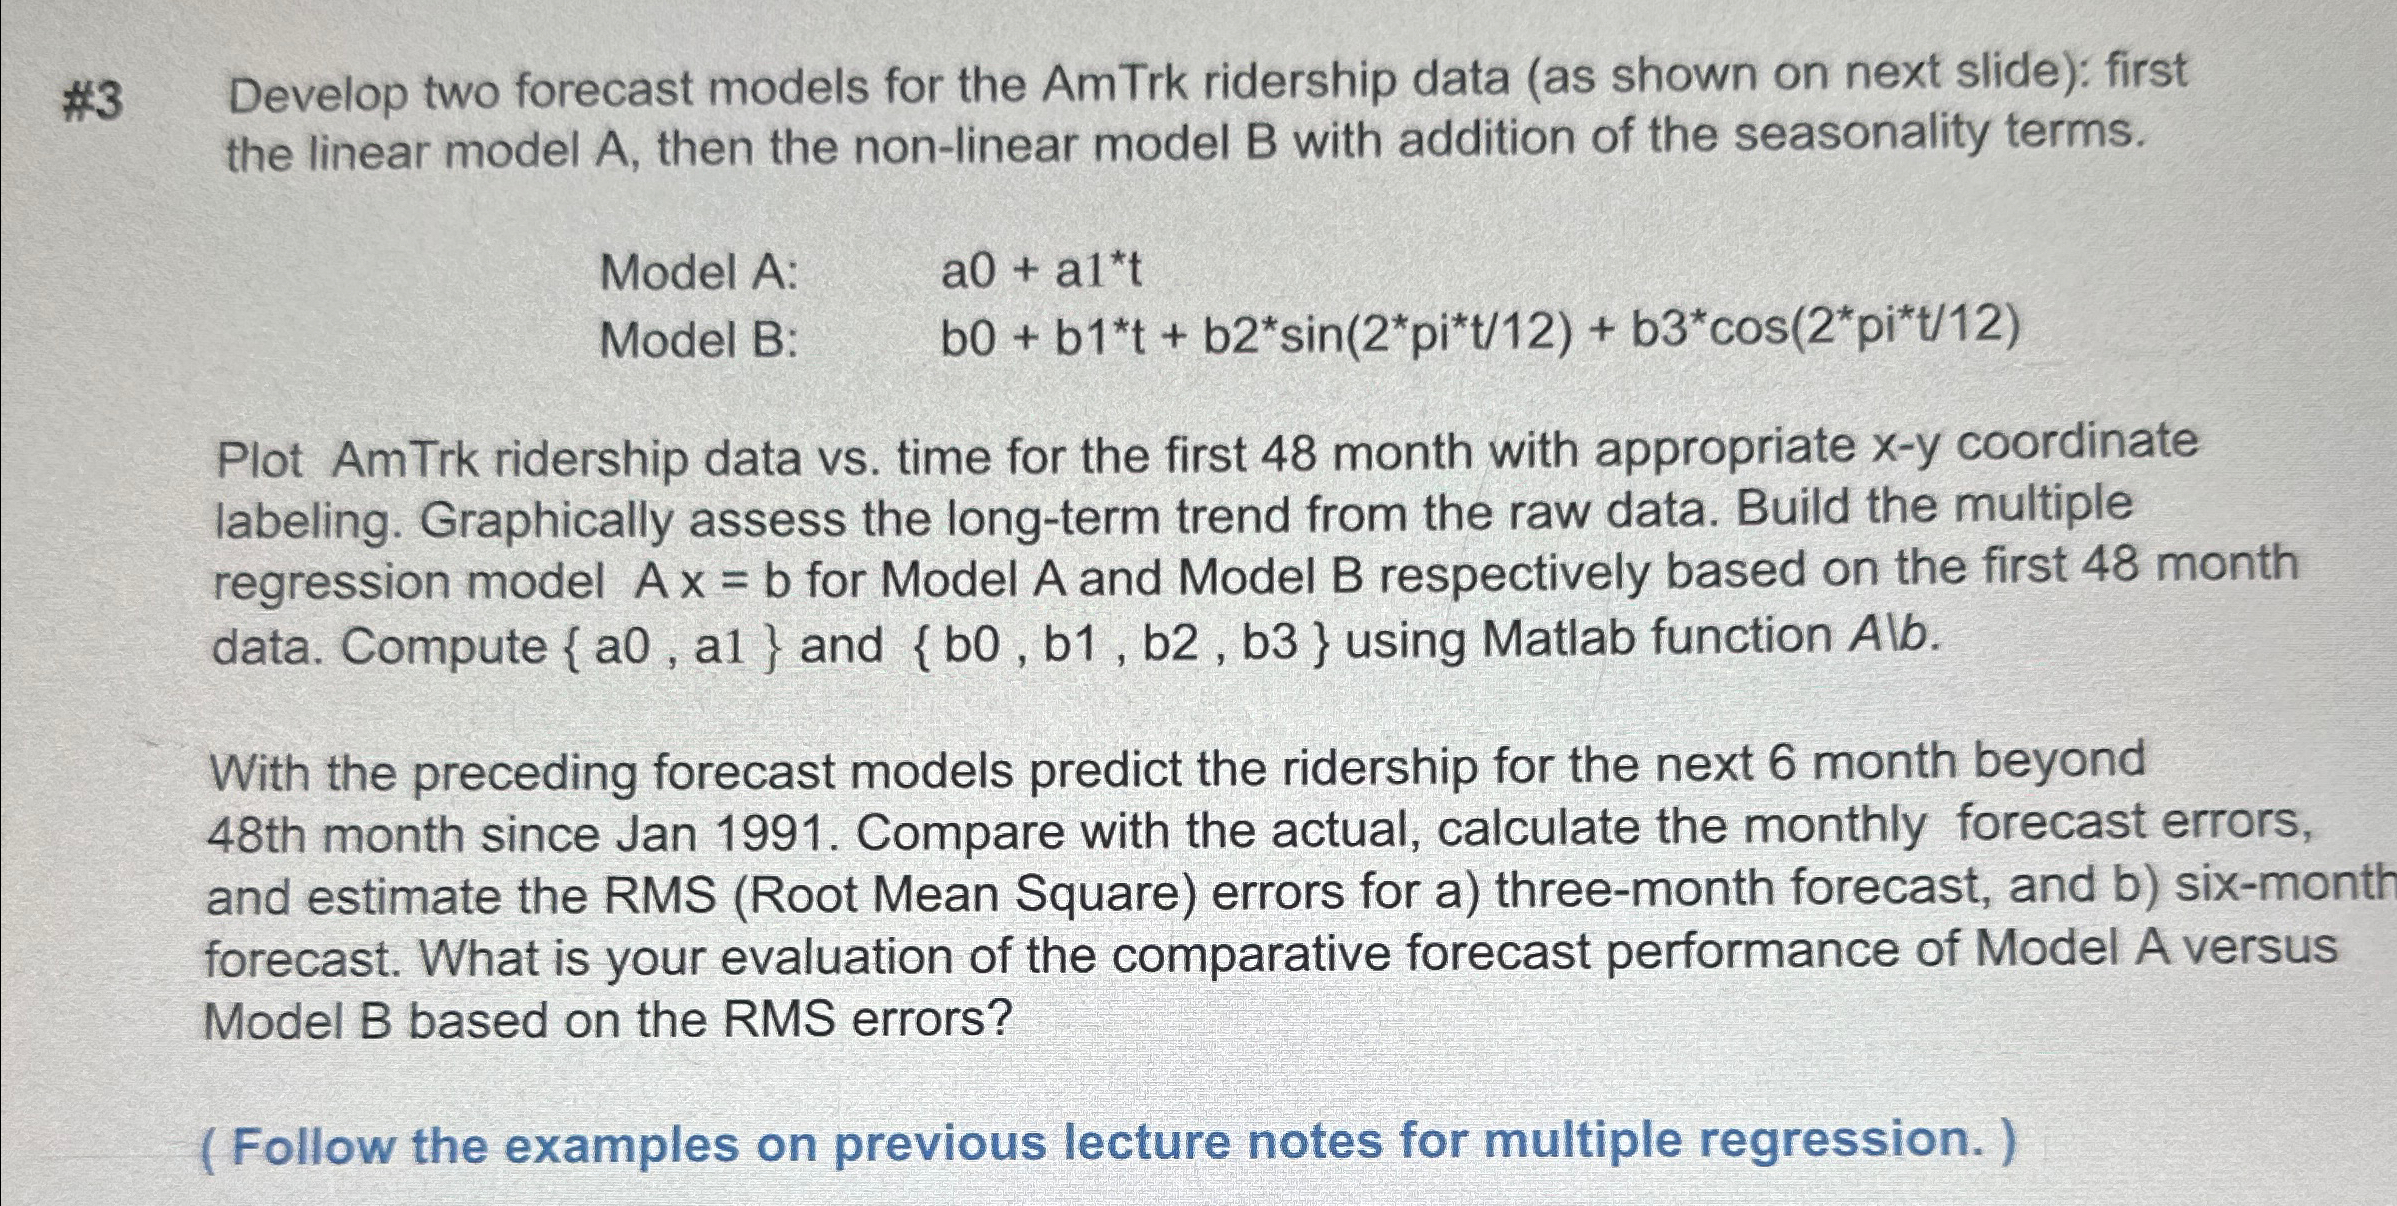
# Develop two forecast models for the AmTrk ridership data as shown on next slide: first the linear model A then the nonlinear model B with addition of the seasonality terms.
Model :
Model :
Plot AmTrk ridership data vs time for the first month with appropriate coordinate labeling. Graphically assess the longterm trend from the raw data. Build the multiple regression model for Model A and Model respectively based on the first month data. Compute and using Matlab function Alb.
With the preceding forecast models predict the ridership for the next month beyond th month since Jan Compare with the actual, calculate the monthly forecast errors, and estimate the RMS Root Mean Square errors for a threemonth forecast, and b sixmonth forecast. What is your evaluation of the comparative forecast performance of Model A versus Model B based on the RMS errors?
Follow the examples on previous lecture notes for multiple regression.
Step by Step Solution
There are 3 Steps involved in it
1 Expert Approved Answer
Step: 1 Unlock

Question Has Been Solved by an Expert!
Get step-by-step solutions from verified subject matter experts
Step: 2 Unlock
Step: 3 Unlock