

Question: 3 different questions Consider the following graph. The table gives the price, in dollars, of a round-trip ticket from Denver to Chicago on a cer
3 different questions
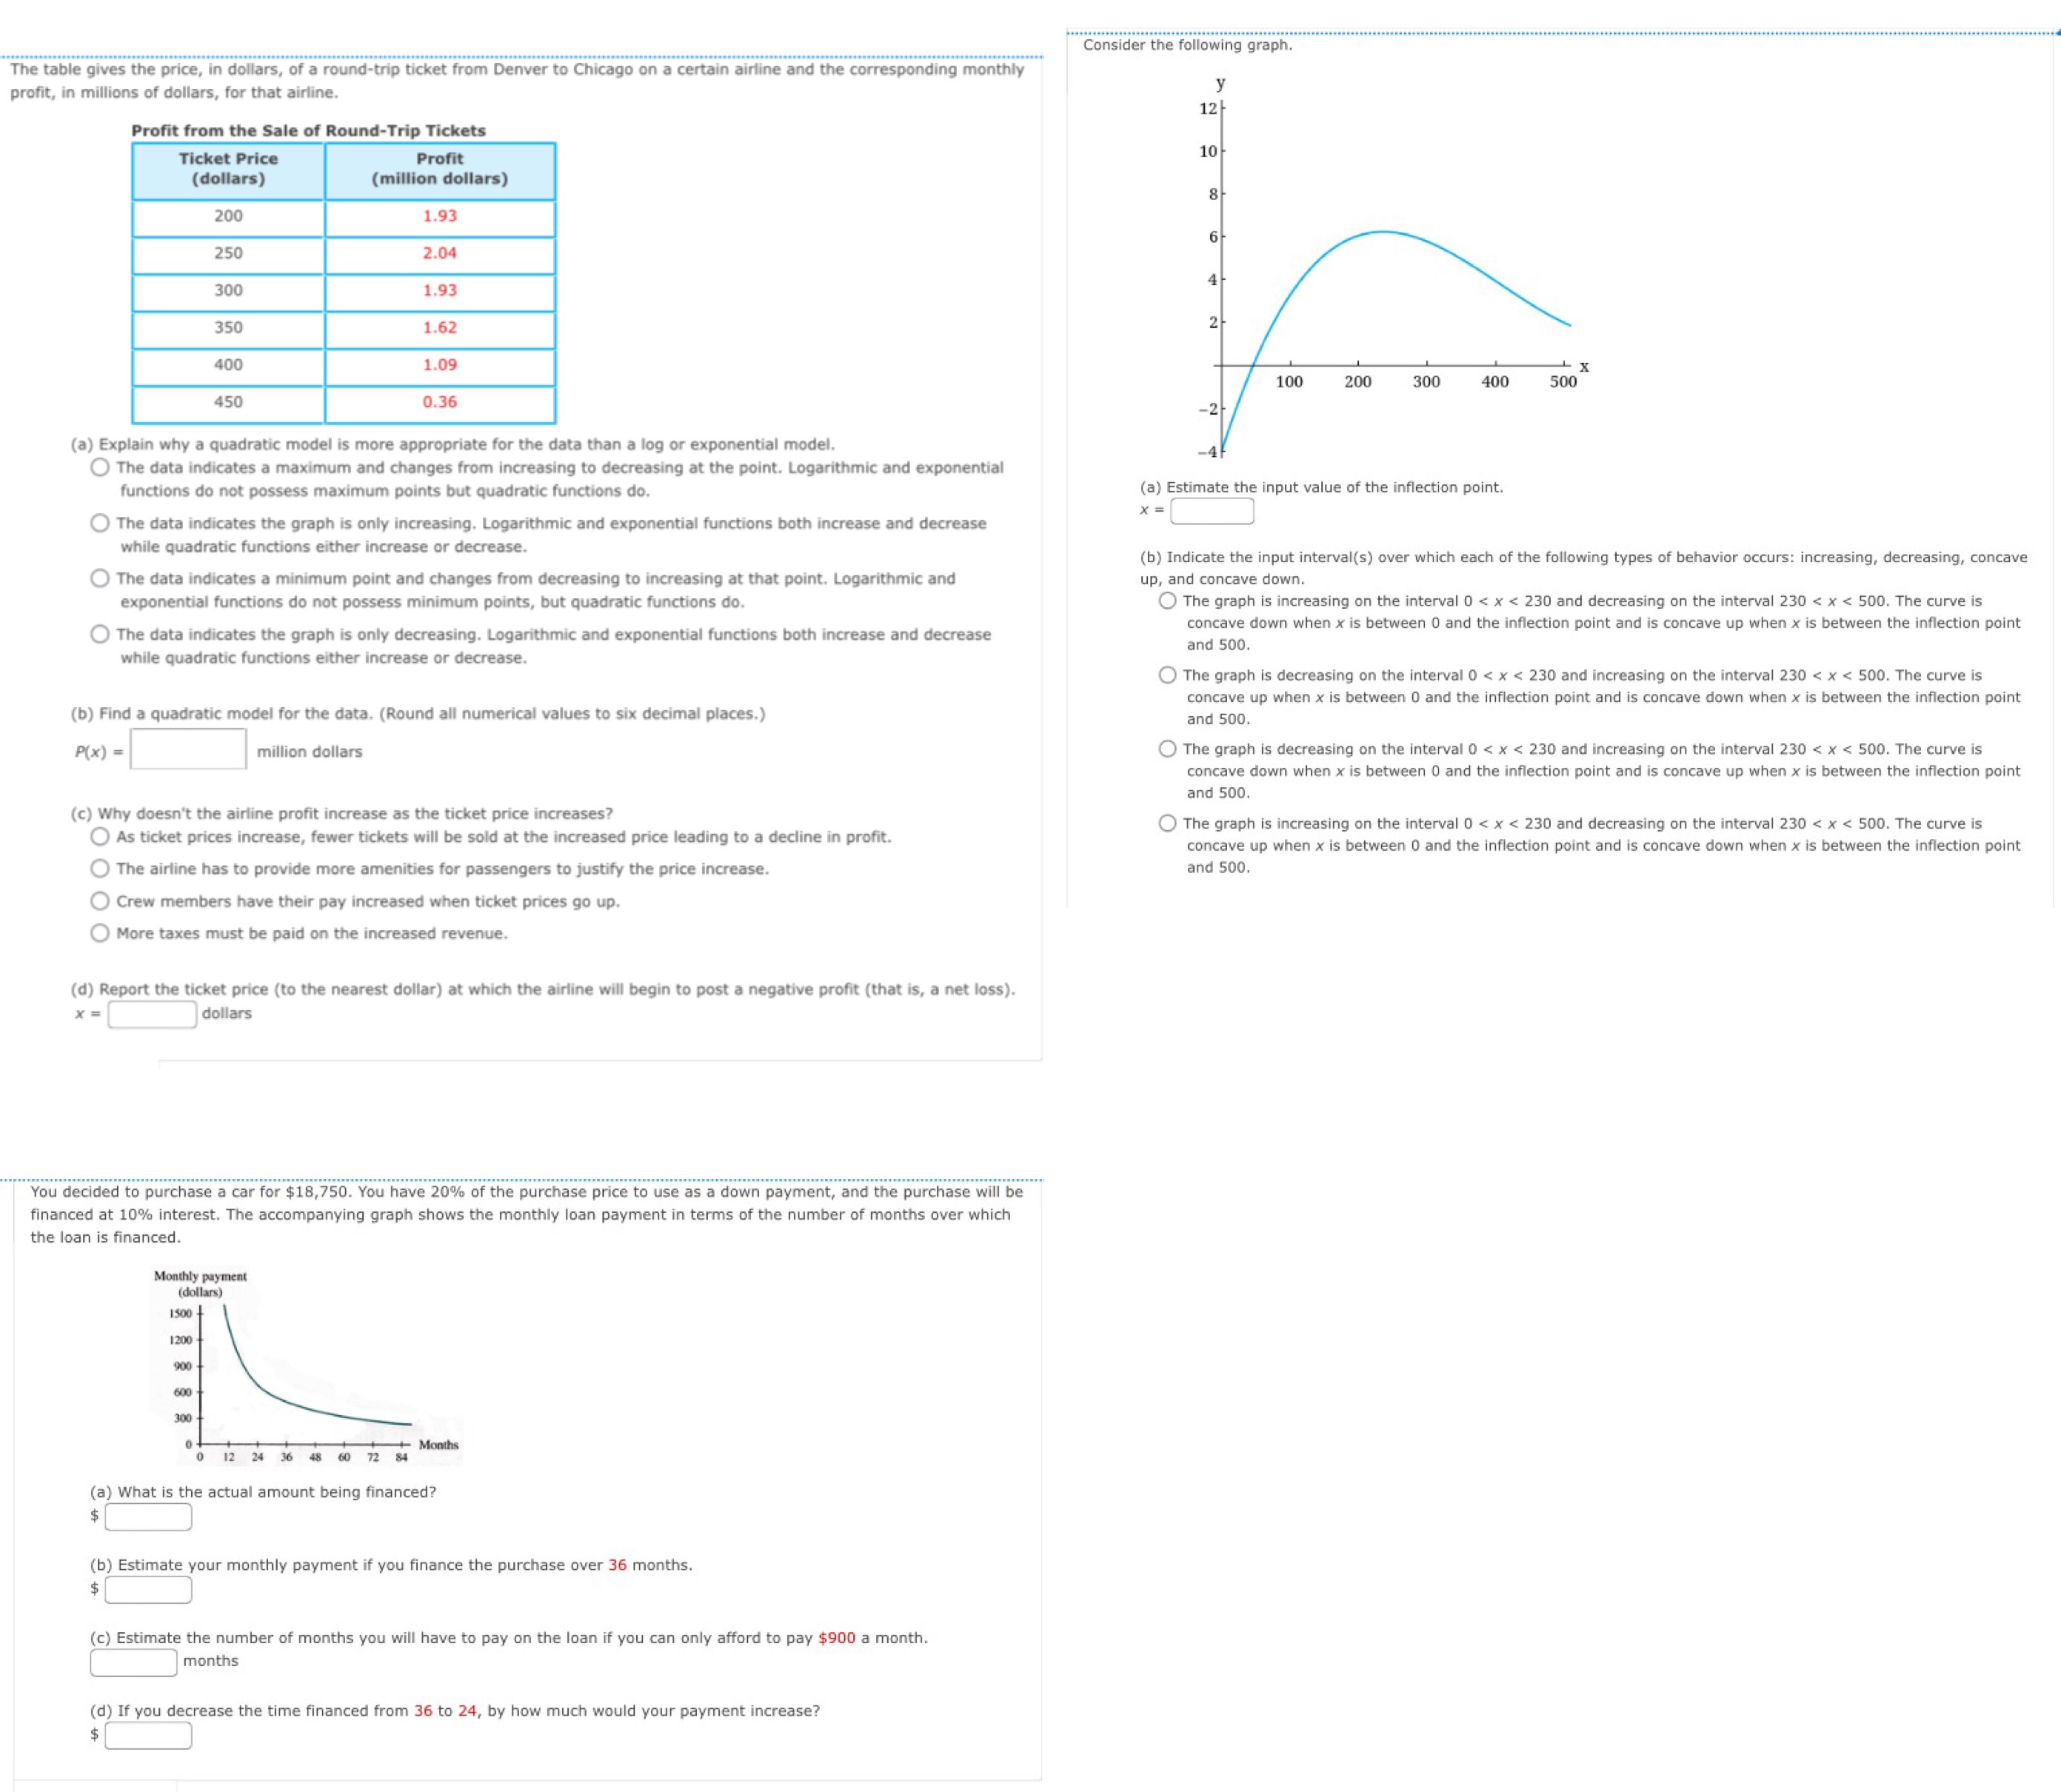
Consider the following graph. The table gives the price, in dollars, of a round-trip ticket from Denver to Chicago on a cer ng monthly profit, in millions of dollars, for that airline. Profit from the Sale of Round-Trip Tickets Ticket Price Profit 10 (dollars) (million dollars) 200 1.93 250 2.04 300 1.93 350 1.62 N 400 1.09 100 200 300 400 500 450 0.36 -2- (a) Explain why a quadratic model is more appropriate for the data than a log or exponential model. The data indicates a maximum and changes from increasing to decreasing at the point. Logarithmic and exponential functions do not possess maximu m points but quadratic functions do. (a) Estimate the input value of the inflection point. x = The data indicates the graph is only increasing. Logarithmic and exponential functions both increase and decrease while quadratic functions rease or decrease. (b) Indicate the input interval(s) over which each of the following types of behavior occurs: increasing, decreasing, concave The data indicates a minimum point and changes from decreasing to increasing at that point. Logarithmic and up, and concave down. exponential functions do not possess minimum points, but quadratic functions do. The graph is increasing on the interval 0
Step by Step Solution
There are 3 Steps involved in it

Get step-by-step solutions from verified subject matter experts