

Question: Please answer all the questions 9. The price system and efficiency [t has been demonstrated that a competitive market economy allocates resources efficiently. Specifically, in


Please answer all the questions


![[=] o Becky 2 . -* @ o 150 B = 6](https://s3.amazonaws.com/si.experts.images/answers/2024/06/6668686f9f067_5116668686f7ac69.jpg)
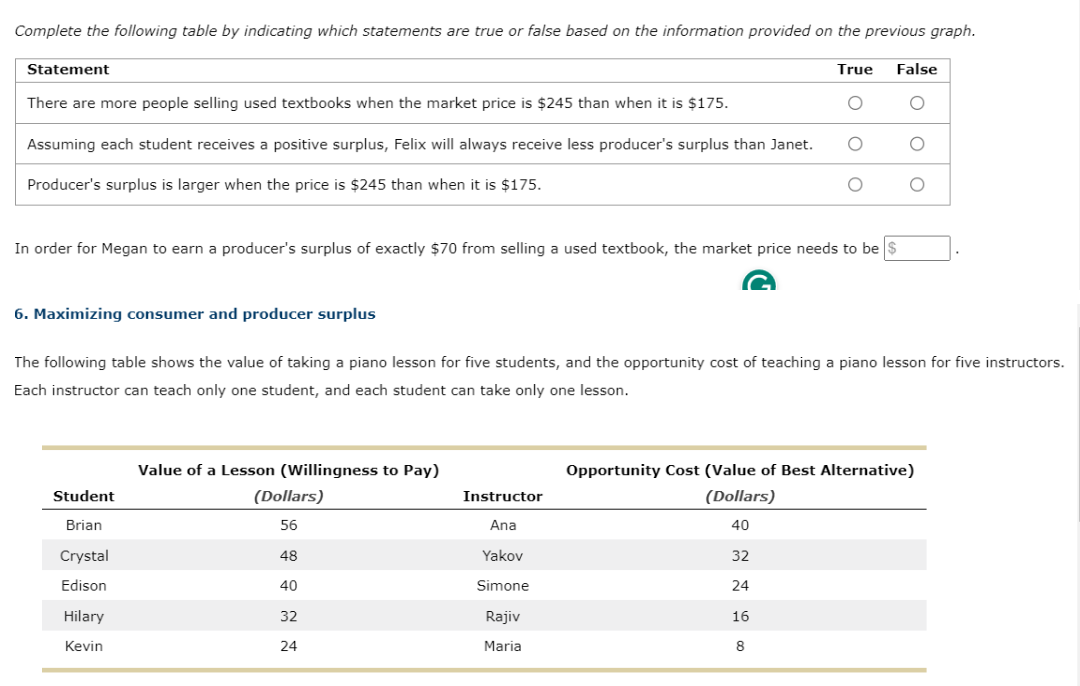


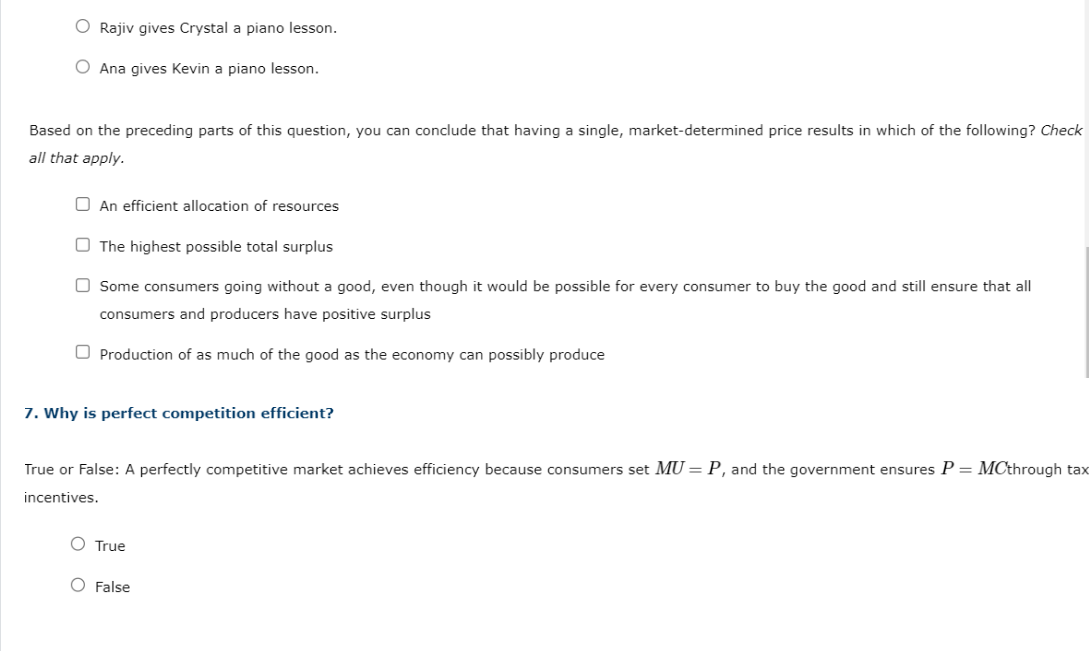
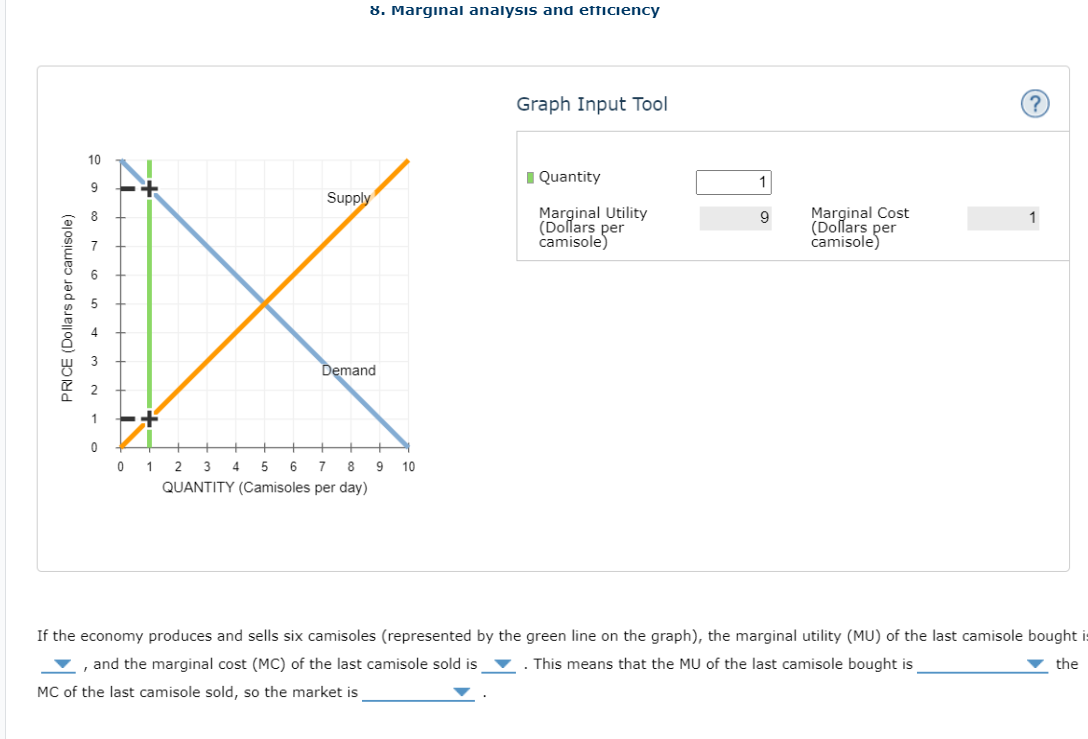
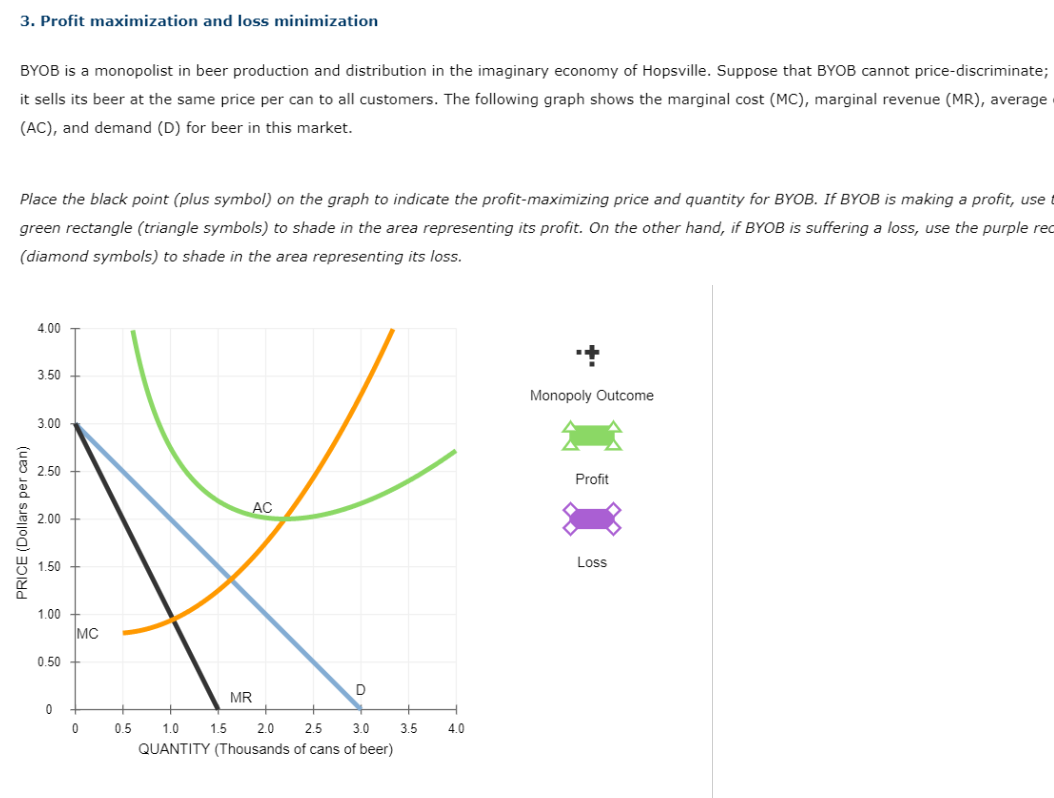
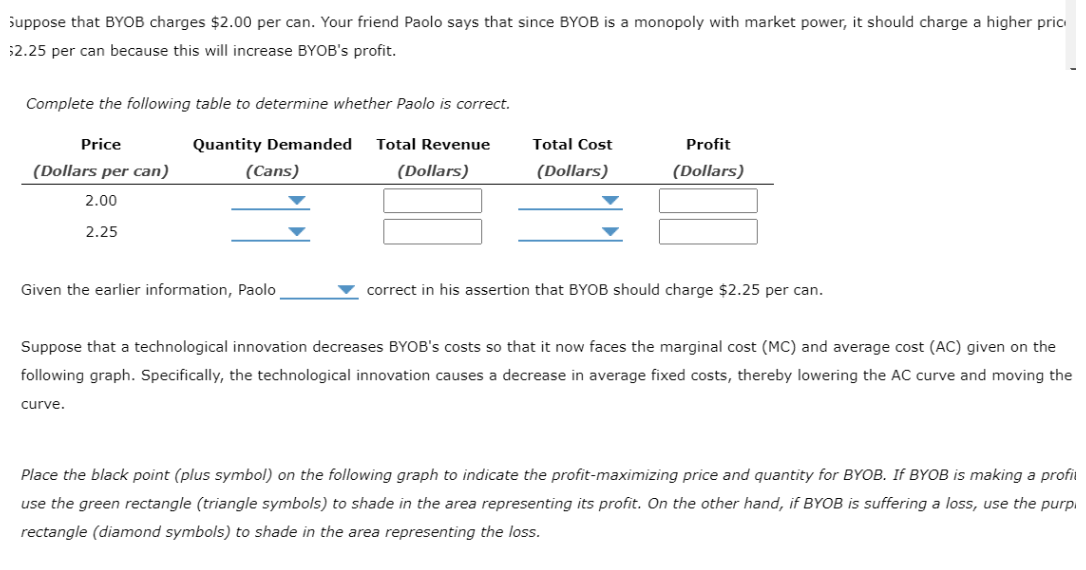


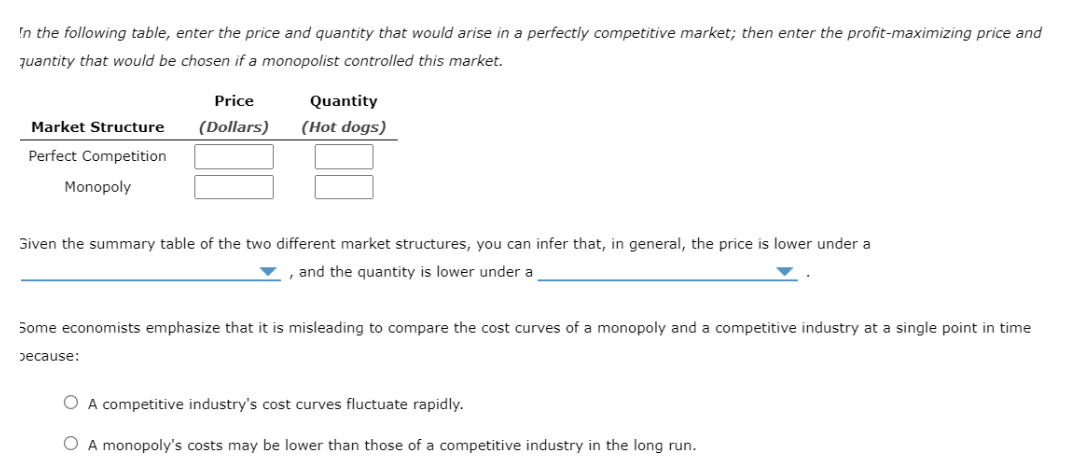
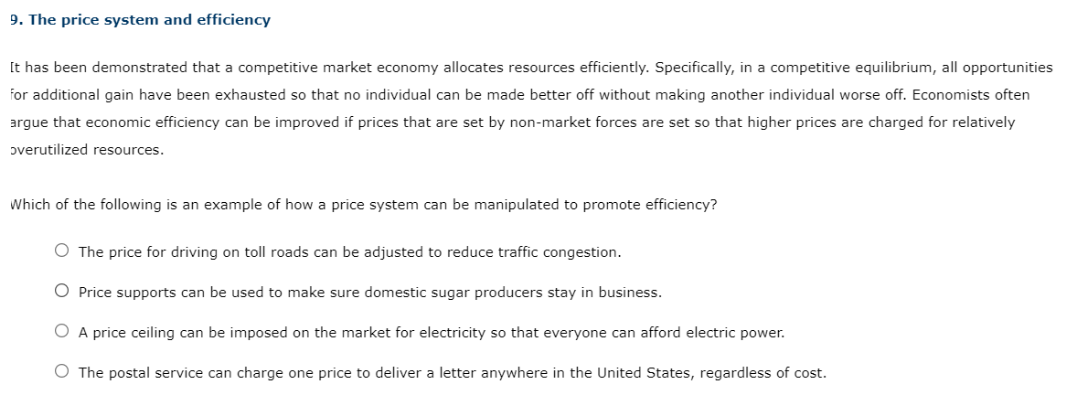
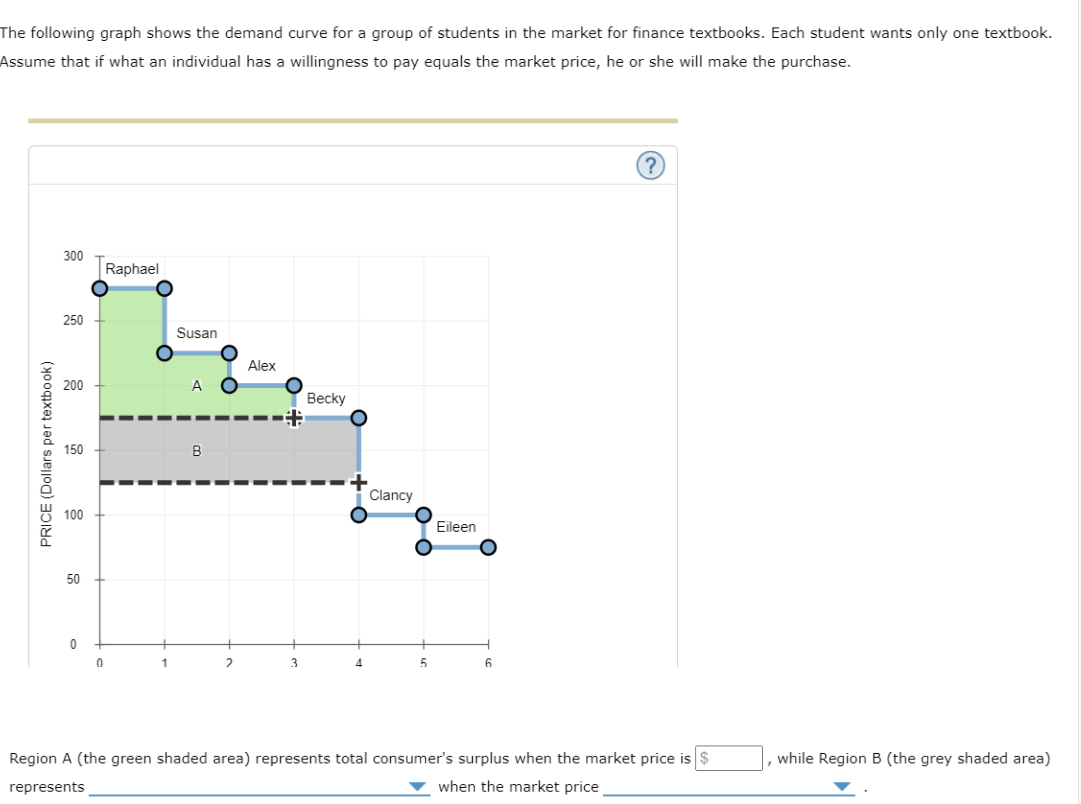
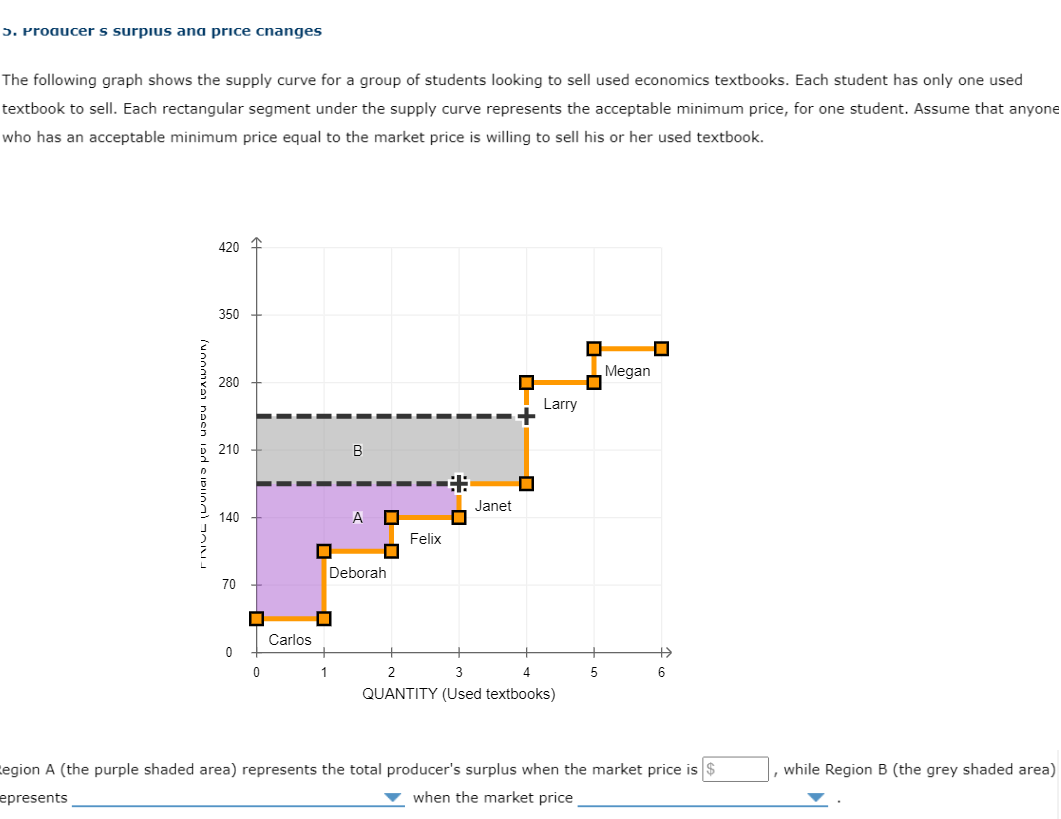
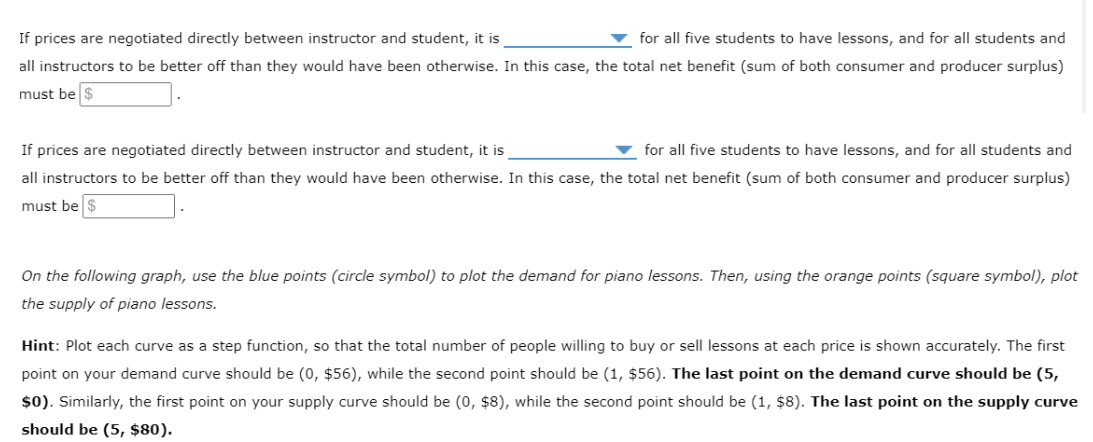
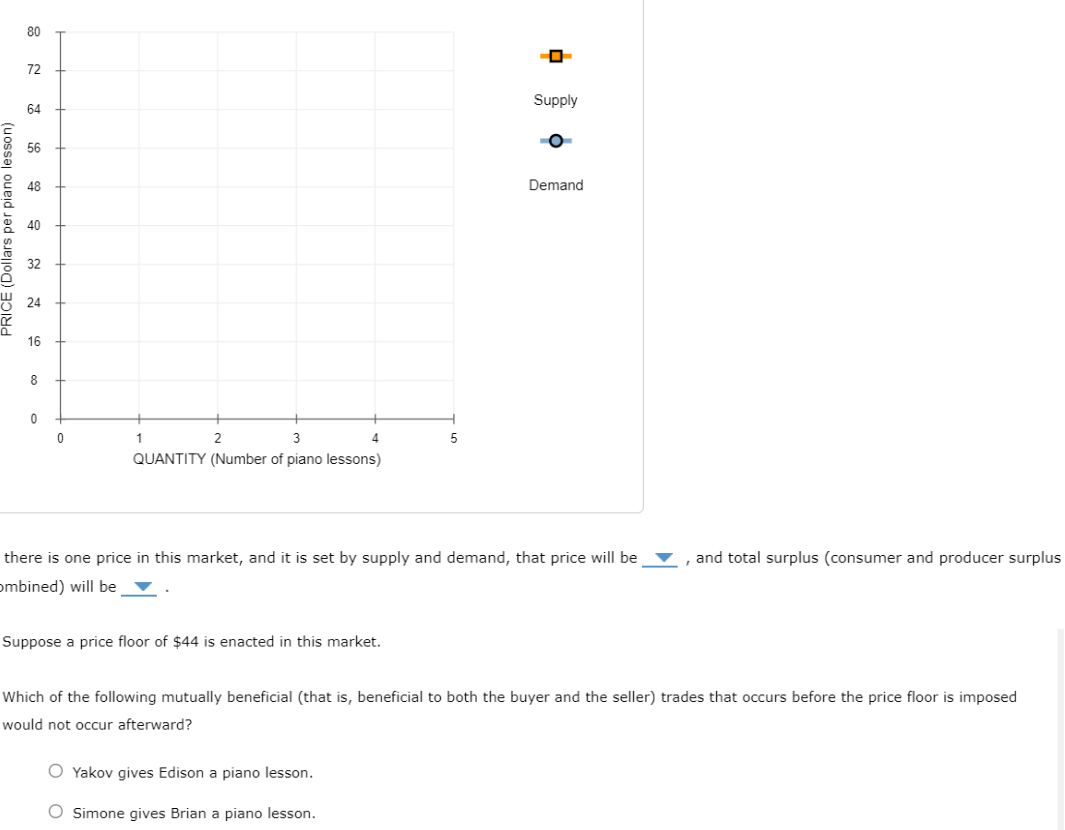
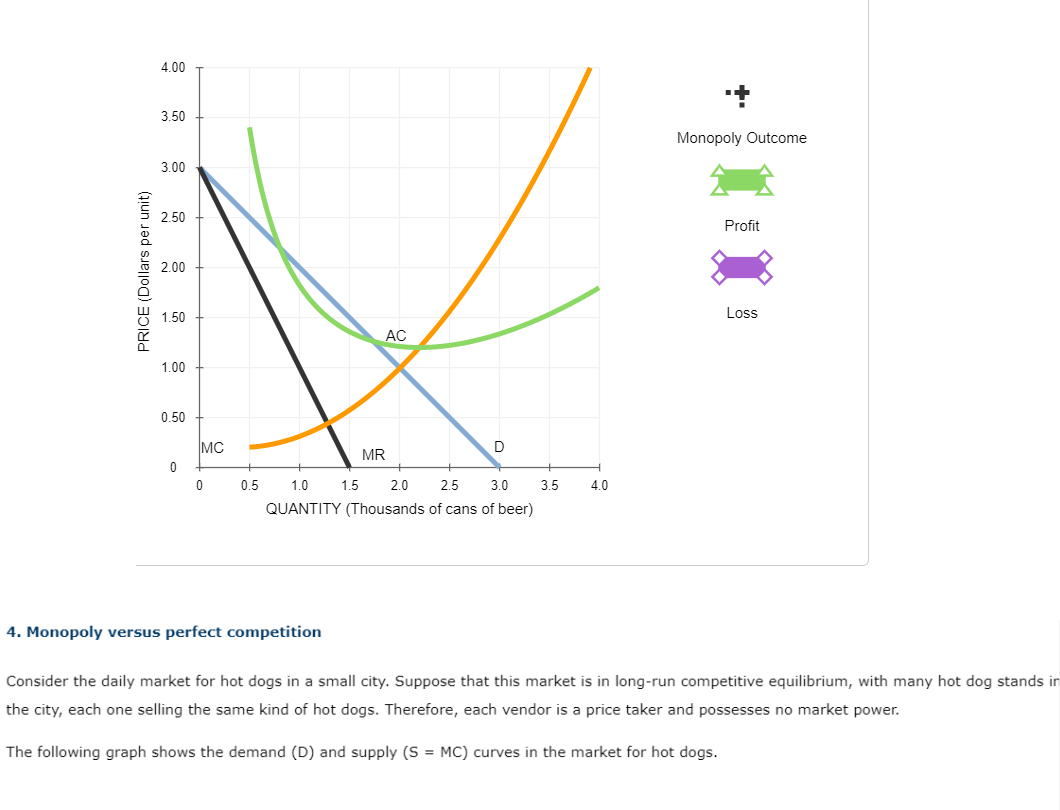
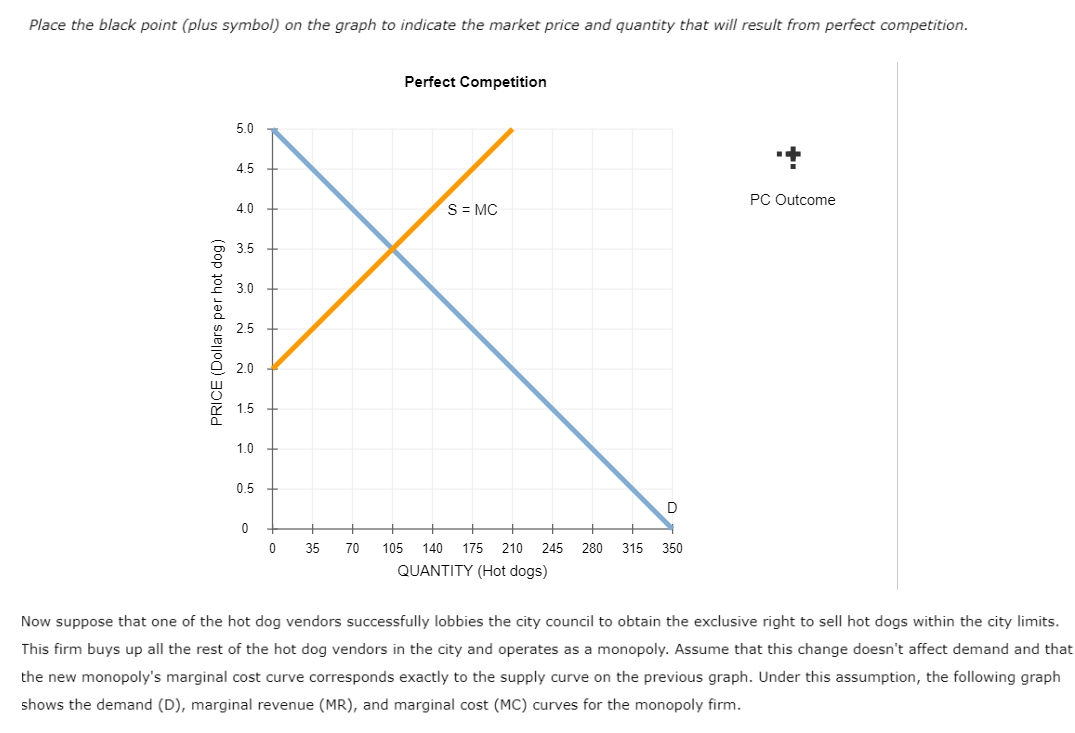
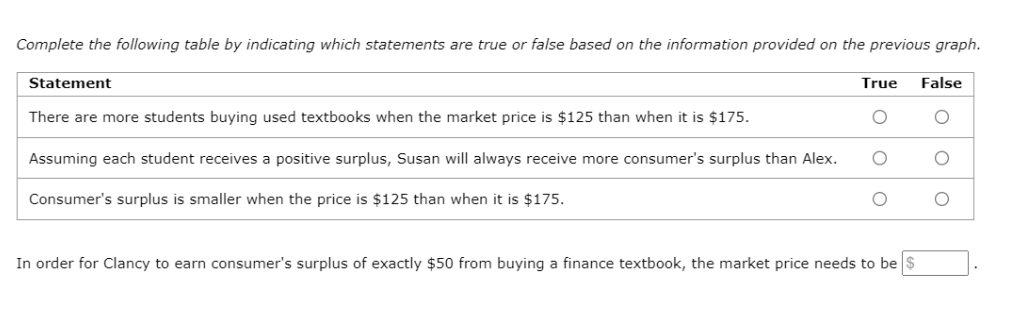
9. The price system and efficiency [t has been demonstrated that a competitive market economy allocates resources efficiently. Specifically, in a competitive equilibrium, all opportunities for additional gain have been exhausted so that no individual can be made better off without making another individual worse off. Economists often argue that economic efficiency can be improved if prices that are set by non-market forces are set so that higher prices are charged for relatively averutilized resources, Which of the following is an example of how a price system can be manipulated to promote efficiency? O The price for driving on toll roads can be adjusted to reduce traffic congestion. O Price supports can be used to make sure domestic sugar producers stay in business. O A price ceiling can be imposed on the market for electricity so that everyone can afford electric power. O The postal service can charge one price to deliver a letter anywhere in the United States, regardless of cost. The following graph shows the demand curve for a group of students in the market for finance textbooks. Each student wants only one textbook. Assume that if what an individual has a willingness to pay equals the market price, he or she will make the purchase. @ = [=] o Becky 2 . -* @ o 150 B = 6 N - Q Clancy w 100 = Eileen a 50 0 - : - - - | 0 1 ? 3 4 5 & Region A (the green shaded area) represents total consumer's surplus when the market price is |5 , while Region B (the grey shaded area) represents W when the market price v Complete the following table by indicating which statements are true or false based on the information provided on the previous graph. Statement True False | There are more students buying used textbooks when the market price is $125 than when it is $175. O O Assuming each student receives a positive surplus, Susan will always receive more consumer's surplus than Alex. O O Consumer's surplus is smaller when the price is $125 than when it is $175. O O In order for Clancy to earn consumer's surplus of exactly $50 from buying a finance textbook, the market price needs to be ; 2. Froaucer s surpius ana price cnanges The following graph shows the supply curve for a group of students looking to sell used economics textbooks. Each student has only one used textbook to sell. Each rectangular segment under the supply curve represents the acceptable minimum price, for one student. Assume that anyone who has an acceptable minimum price equal to the market price is willing to sell his or her used textbook. 420 350 c 2 3 Megan = 260 : L arl Z - l;l_ 210 B L] g 3 2 140 a 2 I L 70 0 i t i ed 0 1 2 3 4 5 6 QUANTITY (Used textbooks) 'egion A (the purple shaded area) represents the total producer's surplus when the market price is , while Region B (the grey shaded area) epresents W when the market price v Complete the following table by indicating which statements are true or false based on the information provided on the previous graph. Statement True False There are more people selling used textbooks when the market price is $245 than when it is $175. Q QO Assuming each student receives a positive surplus, Felix will always receive less producer's surplus than Janet. O O Producer's surplus is larger when the price is $245 than when it is $175. O O In order for Megan to earn a producer's surplus of exactly $70 from selling a used textbook, the market price needs to be |$ ; (@& 6. Maximizing consumer and producer surplus The following table shows the value of taking a piano lesson for five students, and the opportunity cost of teaching a piano lesson for five instructors. Each instructor can teach only one student, and each student can take only one lesson. Value of a Lesson (Willingness to Pay) Opportunity Cost (Value of Best Alternative) Student (Dollars) Instructor (Dollars) Brian 56 Ana 40 Crystal 48 Yakov 32 Edison 40 Simone 24 Hilary 32 Rajiv 16 Kevin 24 Maria 8 If prices are negotiated directly between instructor and student, it is W for all five students to have lessons, and for all students and all instructors to be better off than they would have been otherwise. In this case, the total net benefit (sum of both consumer and producer surplus) must be | $ If prices are negotiated directly between instructor and student, it is W for all five students to have lessons, and for all students and all instructors to be better off than they would have been otherwise. In this case, the total net benefit (sum of both consumer and producer surplus) must be |5 . On the following graph, use the blue points (circle symbol) to plot the demand for piano lessons. Then, using the orange points (square symbol), plot the supply of piano lessons. Hint: Plot each curve as a step function, so that the total number of people willing to buy or sell lessons at each price is shown accurately. The first point on your demand curve should be (0, $56), while the second point should be (1, $56). The last point on the demand curve should be (5, $0). Similarly, the first point on your supply curve should be (0, $8), while the second point should be (1, $8). The last point on the supply curve should be (5, $80). 72 Supply 43 Demand 40 32 24 PRICE (Dollars per piano lesson) 16 0 1 2 3 4 5 QUANTITY (Number of piano lessons) there is one price in this market, and it is set by supply and demand, that price will be % | and total surplus (consumer and producer surplus ymbined) will be W . Suppose a price floor of $44 is enacted in this markst. Which of the following mutually beneficial (that is, beneficial to both the buyer and the seller) trades that occurs before the price floor is imposed would not occur afterward? O Yakov gives Edison a piano lesson. O Simone gives Brian a piano lesson. O Rajiv gives Crystal a piano lesson. O Ana gives Kevin a piano lesson. Based on the preceding parts of this question, you can conclude that having a single, market-determined price results in which of the following? Check all that apply. O An efficient allocation of resources [J The highest possible total surplus [0 Some consumers going without a good, even though it would be possible for every consumer to buy the good and still ensure that all consumers and producers have positive surplus [J Production of as much of the good as the economy can possibly produce 7. Why is perfect competition efficient? True or False: A perfectly competitive market achieves efficiency because consumers set MU = P, and the government ensures P = MC'through tax incentives. QO True O False 8. Marginal analysis and efficiency Graph Input Tool (? 10 Quantity Supply Marginal Utility 9 Marginal Cost (Dollars per (Dollars per camisole) camisole) PRICE (Dollars per camisole) NWA Demand 0 1 2 3 4 5 6 7 8 10 QUANTITY (Camisoles per day) If the economy produces and sells six camisoles (represented by the green line on the graph), the marginal utility (MU) of the last camisole bought , and the marginal cost (MC) of the last camisole sold is . This means that the MU of the last camisole bought is the MC of the last camisole sold, so the market is3. Profit maximization and loss minimization BYOB is a menopolist in beer production and distribution in the imaginary economy of Hopsville. Suppose that BYOB cannot price-discriminate; it sells its beer at the same price per can to all customers. The following graph shows the marginal cost (MC), marginal revenue (MR), average | (AC), and demand (D) for beer in this market. Place the black point (plus symbaol) on the graph to indicate the profit-maximizing price and quantity for BYOB. If BYOB is making a profit, use t green rectangle (triangle symbols) to shade in the area representing its profit. On the other hand, if BYOB is suffering a loss, use the purple rec (diamond symbols) to shade in the area representing its loss. 400 + 350 \"!. Monopoly Outcome 3.00 L amm\\ s [ c 8 250 + s Profit Q. o 8 200 \" 3 150 + Loss o 1.00 + 050 + MR 0 4 - : - : i | 0 05 1.0 15 20 25 30 35 4.0 QUANTITY (Thousands of cans of beer) suppose that BYOB charges $2.00 per can. Your friend Paolo says that since BYOB is a monopoly with market power, it should charge a higher pric 52.25 per can because this will increase BYOB's profit. Complete the following table to determine whether Paolo is correct. Price Quantity Demanded Total Revenue Total Cost Profit (Dollars per can) (Cans) (Dollars) (Dollars) (Dollars) 2.00 v w 2.25 w w Given the earlier information, Paoclo W correct in his assertion that BYOB should charge $2.25 per can. Suppose that a technological innovation decreases BYOB's costs so that it now faces the marginal cost (MC) and average cost (AC) given on the following graph. Specifically, the technological innovation causes a decrease in average fixed costs, thereby lowering the AC curve and moving the curve. Place the black point (plus symbol) on the following graph to indicate the profit-maximizing price and quantity for BYOB. If BYOB is making a profil use the green rectangle (triangle symbols) to shade in the area representing its profit. On the other hand, if BYOB is suffering a loss, use the purpi rectangle (diamond symbeols) to shade in the area representing the loss. 400 v 350 - Monopoly Outcome 3.00 Ly s 250 - Profit o o 8 200 u 8 % 1.50 Loss r o 1.00 0.50 MR D 0 1 0 05 10 15 20 25 3.0 35 40 QUANTITY (Thousands of cans of beer) 4. Monopoly versus perfect competition Consider the daily market for hot dogs in a small city. Suppose that this market is in long-run competitive equilibrium, with many hot dog stands ir the city, each one selling the same kind of hot dogs. Therefore, each vendor is a price taker and possesses no market power. The following graph shows the demand (D) and supply (S = MC) curves in the market for hot dogs. Place the black point (plus symbol) on the graph to indicate the market price and quantity that will result from perfect competition. Perfect Competition PC Qutcome PRICE (Collars per hot dog) 0 35 70 105 140 175 210 245 280 315 350 QUANTITY (Hot dogs) Now suppose that one of the hot dog vendors successfully lobbies the city council to obtain the exclusive right to sell hot dogs within the city limits. This firm buys up all the rest of the hot dog vendors in the city and operates as a monopoly. Assume that this change doesn't affect demand and that the new monopoly's marginal cost curve corresponds exactly to the supply curve on the previous graph. Under this assumption, the following graph shows the demand (D), marginal revenue (MR), and marginal cost (MC) curves for the monopoly firm. Place the black point (plus symbol) on the following graph to indicate the profit-maximizing price and quantity of a monopolist. Monopoly 5.0 45 Monopoly Outcome 4.0 MC 3.5 3.0 2.5 2.0 1.5 1.0 0.5 MR 0 35 70 105 140 175 210 245 280 315 350 QUANTITY (Hot dogs) In the following table, enter the price and quantity that would arise in a perfectly competitive market; then enter the profit-maximizing price and quantity that would be chosen if a monopolist controlled this market.'n the following table, enter the price and quantity that would arise in a perfectly competitive market; then enter the profit-maximizing price and juantity that would be chosen if 3 monopolist controlled this market. Price Quantity Market Structure (Dollars) (Hot dogs) Perfect Competition E ': L [ Monopoly Siven the summary table of the two different market structures, you can infer that, in general, the price is lower under a W , and the quantity is lower under a v Some economists emphasize that it is misleading to compare the cost curves of a monopoly and a competitive industry at a single point in time Jecause: O A competitive industry's cost curves fluctuate rapidly. O A monopoly's costs may be lower than those of a competitive industry in the long run
Step by Step Solution
There are 3 Steps involved in it

Get step-by-step solutions from verified subject matter experts