

Question: 3. Download the data from the following data table ( you can watch the following video on how you can convert the below table to
3. Download the data from the following data table ( you can watch the following video on how you can convert the below table to excel file . How To Download the Table ' )
a . Compute the average return for each of the assets from 2008 to 2019 .
b . Compute the variance and standard deviation for each of the assets from 2008 to 2019 .
c . Which asset was riskiest during the time between 2008-2019 ? How does that fit with your intuition ? .
Compute the average return for each of the assets from 2008 to 2019 .
a . Compute the average return for each of the assets from 2008 to 2019 .
The average return for the S & P 500 was The average return for the Small Stocks was The average return for the Carp Bands was The average return for the World Portfolio was The average return for the Treasury Bils was The average for the CPI was ( Round to five decimal places . )
b . Compute the variance and standard deviation for each of the assets from 2008 to 2019 .
The variance for the S & P 500 was ( Round to five decimal places . )
The variance for the Small Stocks was ( Round to five decimal places . ) ( Round to five decimal places . )
the World Portfolio was ( Round to five decimal places . )
The variance for the Treasury Bils was ( Round to five decimal places . )
The variance for the CPI was The standard deviation for the S & P 500 was
The standard deviation for the Small Stocks was The standard deviation for the Corp Bonds was
The standard deviation for the World Portfolio was The standard deviation for the Treasury Bills was
Also stander devantion for CPI was.....
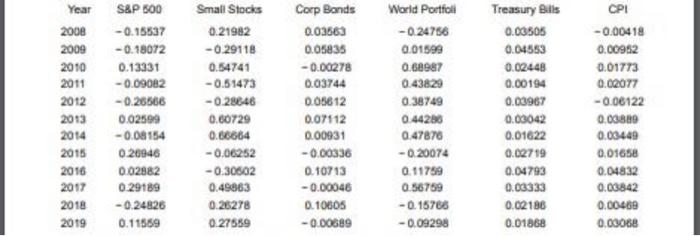
Year S&P 500 2008 -0.16537 2009 -0.18072 2010 0.13331 2011 -0.09082 2012 -0.26566 2013 0.02599 2014 -0.08154 2015 0.20946 2016 0.02882 2017 0.29189 2018 -0.24826 2019 0.11569 Small Stocks 0.21982 -0.29118 0.54741 -0.51473 -0.28648 0.60729 0.66664 -0.06252 -0.30502 0.49863 0.26278 0.27559 Corp Bonds 0.03563 0.05835 -0.00278 0.03744 0.05612 0.07112 0.00931 -0.00336 0.10713 -0.00046 0.10605 -0.00689 World Portfoli -0.24756 0.01599 0.68987 0.43820 0.36749 0.44280 0.47870 -0.20074 0.11759 0.58759 -0.15766 -0.09298 Treasury Bills 0.03505 0.04553 0.02448 0.00194 0.03967 0.03042 0.01622 0.02719 0.04793 0.03333 0.02186 0.01868 CPI -0.00418 0.00952 0.01773 0.02077 -0.06122 0.03849 0.03449 0.0165 0.04832 0.00842 0.00469 0.08088 Year S&P 500 2008 -0.16537 2009 -0.18072 2010 0.13331 2011 -0.09082 2012 -0.26566 2013 0.02599 2014 -0.08154 2015 0.20946 2016 0.02882 2017 0.29189 2018 -0.24826 2019 0.11569 Small Stocks 0.21982 -0.29118 0.54741 -0.51473 -0.28648 0.60729 0.66664 -0.06252 -0.30502 0.49863 0.26278 0.27559 Corp Bonds 0.03563 0.05835 -0.00278 0.03744 0.05612 0.07112 0.00931 -0.00336 0.10713 -0.00046 0.10605 -0.00689 World Portfoli -0.24756 0.01599 0.68987 0.43820 0.36749 0.44280 0.47870 -0.20074 0.11759 0.58759 -0.15766 -0.09298 Treasury Bills 0.03505 0.04553 0.02448 0.00194 0.03967 0.03042 0.01622 0.02719 0.04793 0.03333 0.02186 0.01868 CPI -0.00418 0.00952 0.01773 0.02077 -0.06122 0.03849 0.03449 0.0165 0.04832 0.00842 0.00469 0.08088
Step by Step Solution
There are 3 Steps involved in it

Get step-by-step solutions from verified subject matter experts