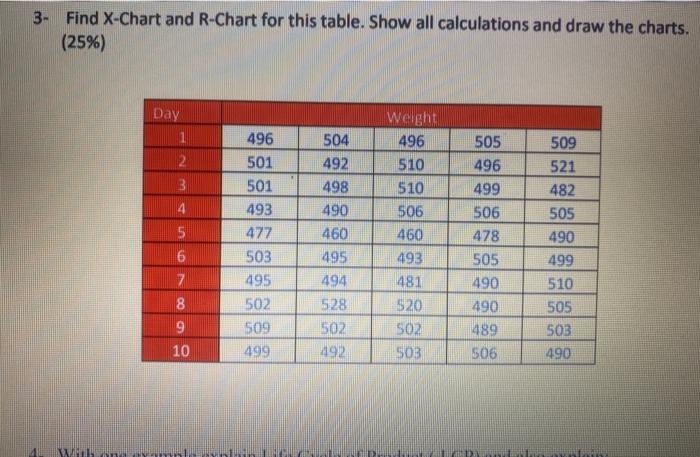
Question: 3- Find X-Chart and R-Chart for this table. Show all calculations and draw the charts. (25%) Day 1 2 3 4 5 496 501 501

3- Find X-Chart and R-Chart for this table. Show
3- Find X-Chart and R-Chart for this table. Show all calculations and draw the charts. (25%) Day 1 2 3 4 5 496 501 501 493 477 503 495 502 509 499 504 492 498 490 460 495 494 528 502 492 Weight 496 510 510 506 460 493 481 920 502 503 505 496 499 506 478 505 490 490 489 506 509 521 482 505 490 499 510 505 503 490 8 6 7 8 9 10

Step by Step Solution

There are 3 Steps involved in it

1 Expert Approved Answer
Step: 1 Unlock blur-text-image
Question Has Been Solved by an Expert!

Get step-by-step solutions from verified subject matter experts

Step: 2 Unlock
Step: 3 Unlock

Students Have Also Explored These Related General Management Questions!