

Question: 3 Functions and control flows a. Write an R function called descr_stats that, given a data frame, returns the number of missing values per each
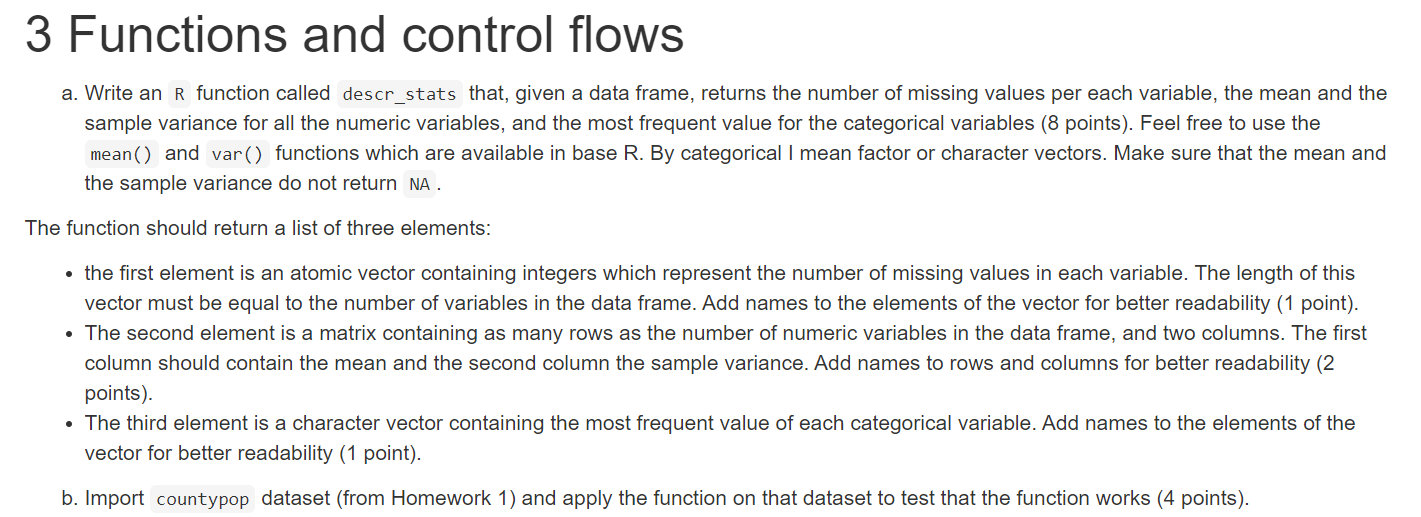
3 Functions and control flows a. Write an R function called descr_stats that, given a data frame, returns the number of missing values per each variable, the mean and the sample variance for all the numeric variables, and the most frequent value for the categorical variables (8 points). Feel free to use the mean() and var() functions which are available in base R. By categorical I mean factor or character vectors. Make sure that the mean and the sample variance do not return NA . The function should return a list of three elements: - the first element is an atomic vector containing integers which represent the number of missing values in each variable. The length of this vector must be equal to the number of variables in the data frame. Add names to the elements of the vector for better readability (1 point). - The second element is a matrix containing as many rows as the number of numeric variables in the data frame, and two columns. The rst column should contain the mean and the second column the sample variance. Add names to rows and columns for better readability (2 points). - The third element is a character vector containing the most frequent value of each categorical variable. Add names to the elements of the vector for better readability (1 point). b. Import countypop dataset (from Homework 1) and apply the function on that dataset to test that the function works (4 points)
Step by Step Solution
There are 3 Steps involved in it

Get step-by-step solutions from verified subject matter experts