

Question: 3. Here is an example with some data. Make a plot of the data and fit a curve (line). a Sandwich Hamburger Cheeseburger ax
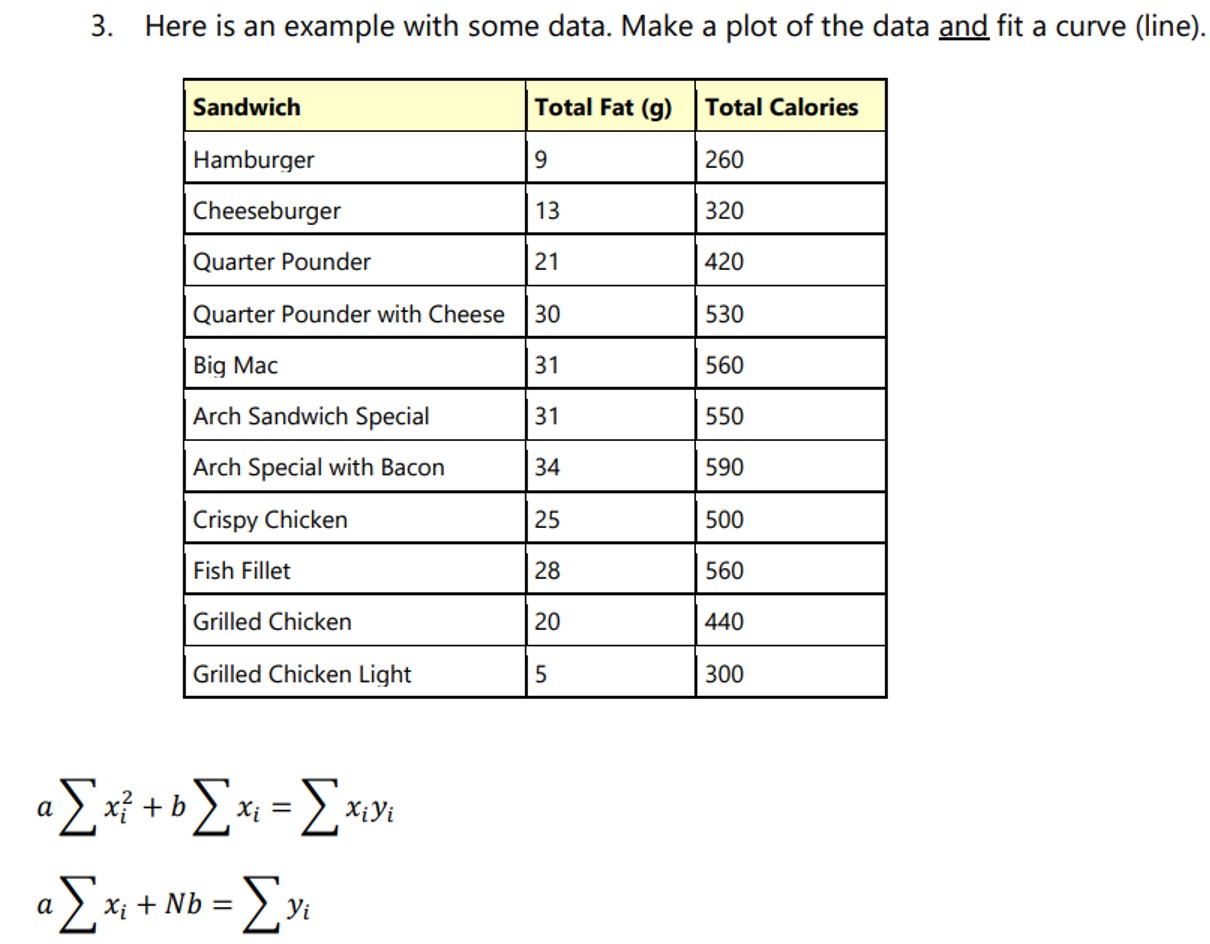
3. Here is an example with some data. Make a plot of the data and fit a curve (line). a Sandwich Hamburger Cheeseburger ax + b[x = xx Xiyi Quarter Pounder Quarter Pounder with Cheese Big Mac Arch Sandwich Special Arch Special with Bacon Crispy Chicken Fish Fillet Grilled Chicken Grilled Chicken Light xi + + Nb = [y Yi Total Fat (g) Total Calories 9 260 13 320 21 420 530 560 30 31 31 34 222 25 28 20 5 550 590 500 560 440 300
Step by Step Solution
There are 3 Steps involved in it
Solutions Step 1 Putting all values in the table we get a sum of all values SNo x ... View full answer

Get step-by-step solutions from verified subject matter experts