

Question: 3. Hypothesis testing with sample means (small samples) Most engaged couples expect or at least hope they will have high levels of marital longevity. However,
3. Hypothesis testing with sample means (small samples)
Most engaged couples expect or at least hope they will have high levels of marital longevity. However, because 54% of first marriages end in divorce, social scientists have begun investigating influences on marital longevity. (Data source: These data were obtained from the National Center for Health Statistics.)
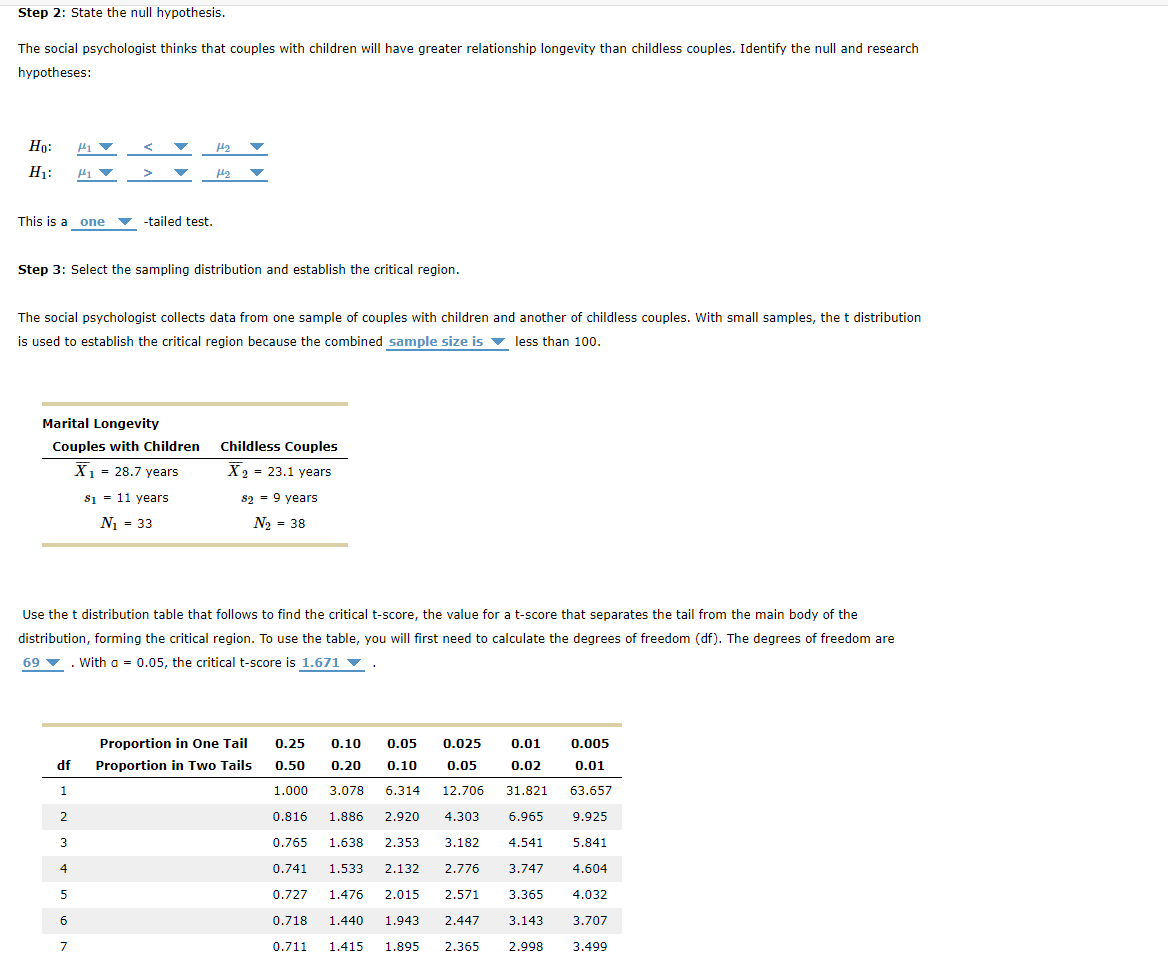
Suppose a social psychologist sets out to study the role of having children in marital longevity. She measures marital longevity in a random sample of couples with children and in a random sample of childless couples and compares the data. Assume that marital longevity is normally distributed and that the variance in longevity is approximately the same among couples with children as among childless couples.
The social psychologist collects data from one sample of couples with children and another of childless couples. With small samples, the t distribution is used to establish the critical region because the combined sample size is less than 100.
Marital Longevity
Couples with Children
X?1= 28.7 years
s1= 11 years
N1= 33N
Childless Couples
X?2= 23.1 yearss
s2= 9 yearsN
N2= 38
Use the t distribution table that follows to find the critical t-score, the value for a t-score that separates the tail from the main body of the distribution, forming the critical region. To use the table, you will first need to calculate the degrees of freedom (df). The degrees of freedom are 69 . With ? = 0.05, the critical t-score is1.671 .
Please explain Step 4 and Step 5. Use screenshot for reference. Thank you
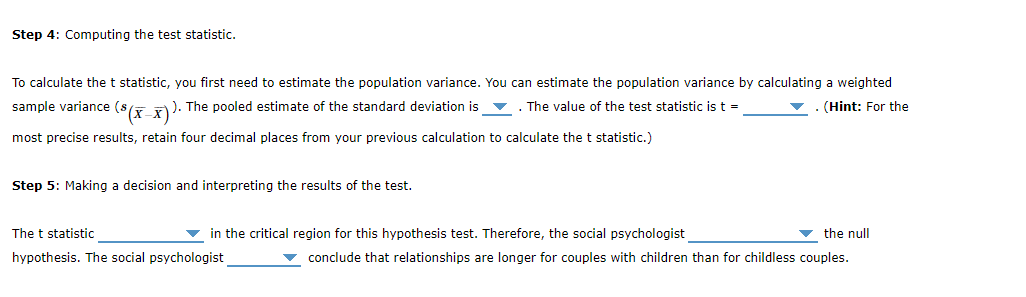
Step 4: Computing the test statistic.
To calculate the t statistic, you first need to estimate the population variance. You can estimate the population variance by calculating a weighted sample variance (sX??X?). The pooled estimate of the standard deviation is______ choices are: 4.30, 2.41, 6.75, 8.50 . The value of the test statistic is t =choices are: 2.32, 0.51, 2.09, 9.54 . (Hint:For the most precise results, retain four decimal places from your previous calculation to calculate the t statistic.)
Step 5: Making a decision and interpreting the results of the test.
The t statistic _____ choices are: lies or does not liein the critical region for this hypothesis test. Therefore, the social psychologist____ choices are rejects, or does not reject. the null hypothesis. The social psychologist ____ choices are: cannot, or canconclude that relationships are longer for couples with children than for childless couples.
Please see screenshot for more information. Thank you :)
\f\f
Step by Step Solution
There are 3 Steps involved in it

Get step-by-step solutions from verified subject matter experts