

Question: Please answer all blanks especially the ones in BOLD. I attached screenshots for reference. 3. Hypothesis testing with sample means (small samples) Most engaged couples
Please answer all blanks especially the ones in BOLD. I attached screenshots for reference.
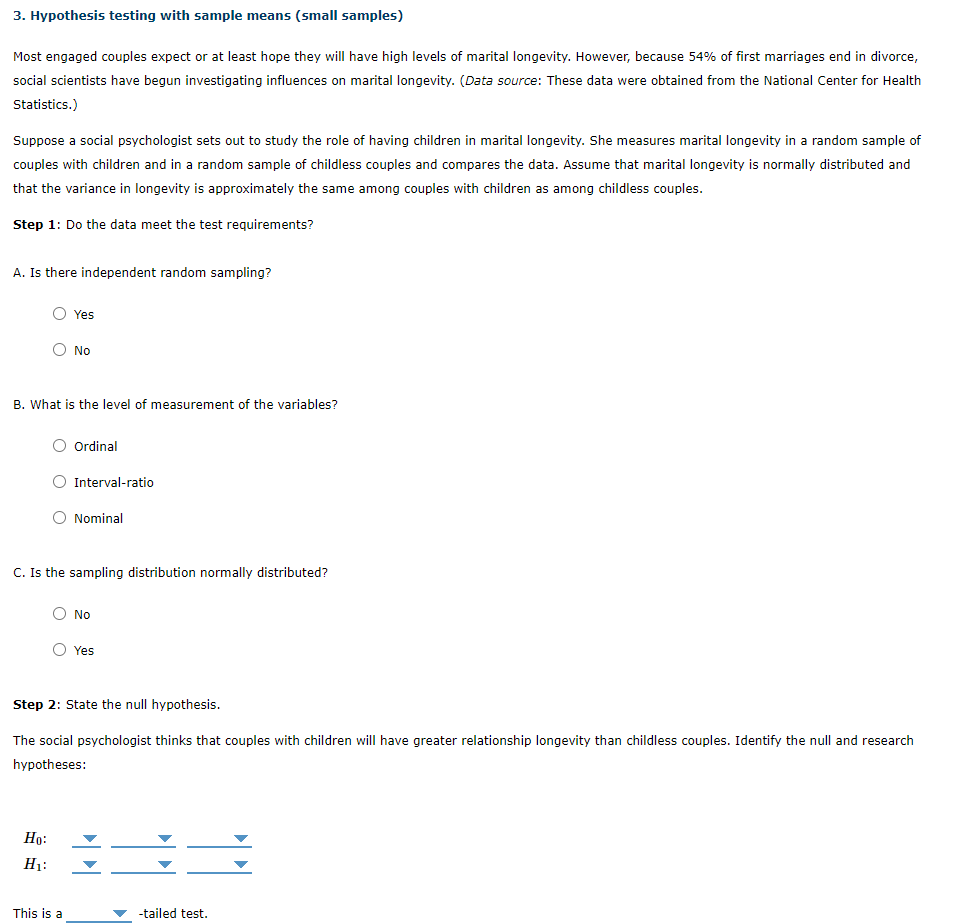
3. Hypothesis testing with sample means (small samples)
Most engaged couples expect or at least hope they will have high levels of marital longevity. However, because 54% of first marriages end in divorce, social scientists have begun investigating influences on marital longevity. (Data source: These data were obtained from the National Center for Health Statistics.)
Suppose a social psychologist sets out to study the role of having children in marital longevity. She measures marital longevity in a random sample of couples with children and in a random sample of childless couples and compares the data. Assume that marital longevity is normally distributed and that the variance in longevity is approximately the same among couples with children as among childless couples.
Step 1: Do the data meet the test requirements?
A. Is there independent random sampling? CHOOSE:
Yes
No
B. What is the level of measurement of the variables? CHOOSE:
Ordinal
Interval-ratio
Nominal
C. Is the sampling distribution normally distributed? CHOOSE:
No
Yes
Step 2: State the null hypothesis.
The social psychologist thinks that couples with children will have greater relationship longevity than childless couples. Identify the null and research hypotheses:
| H0H0: |
|
| H1H1: |
|
This is a -tailed test. CHOICES ARE: ONE OR TWO TAILED TEST?
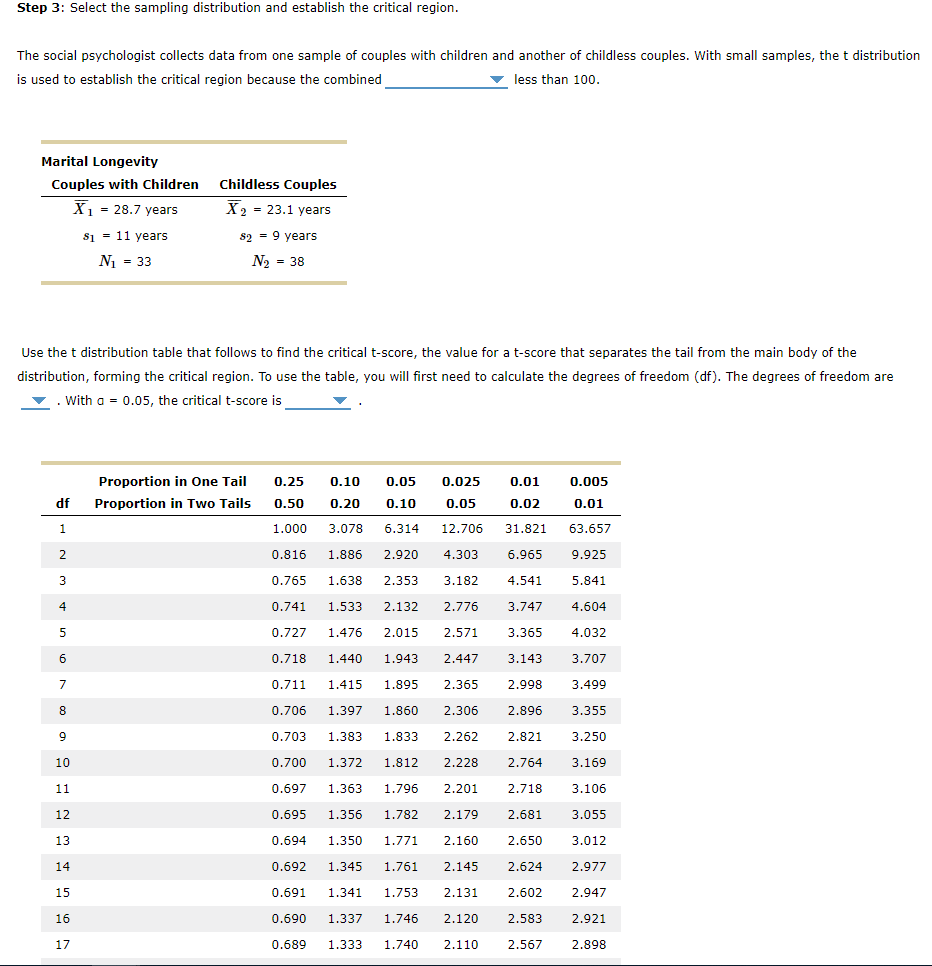
Step 3: Select the sampling distribution and establish the critical region.
The social psychologist collects data from one sample of couples with children and another of childless couples. With small samples, the t distribution is used to establish the critical region because the combinedCHOICES ARE: MEANS ARE, OR SAMPLE SIZE IS less than 100.
Marital Longevity
| Couples with Children | Childless Couples |
| X1X1 = 28.7 years | X2X2 = 23.1 years |
| s1s1 = 11 years | s2s2 = 9 years |
| N1N1 = 33 | N2N2 = 38 |
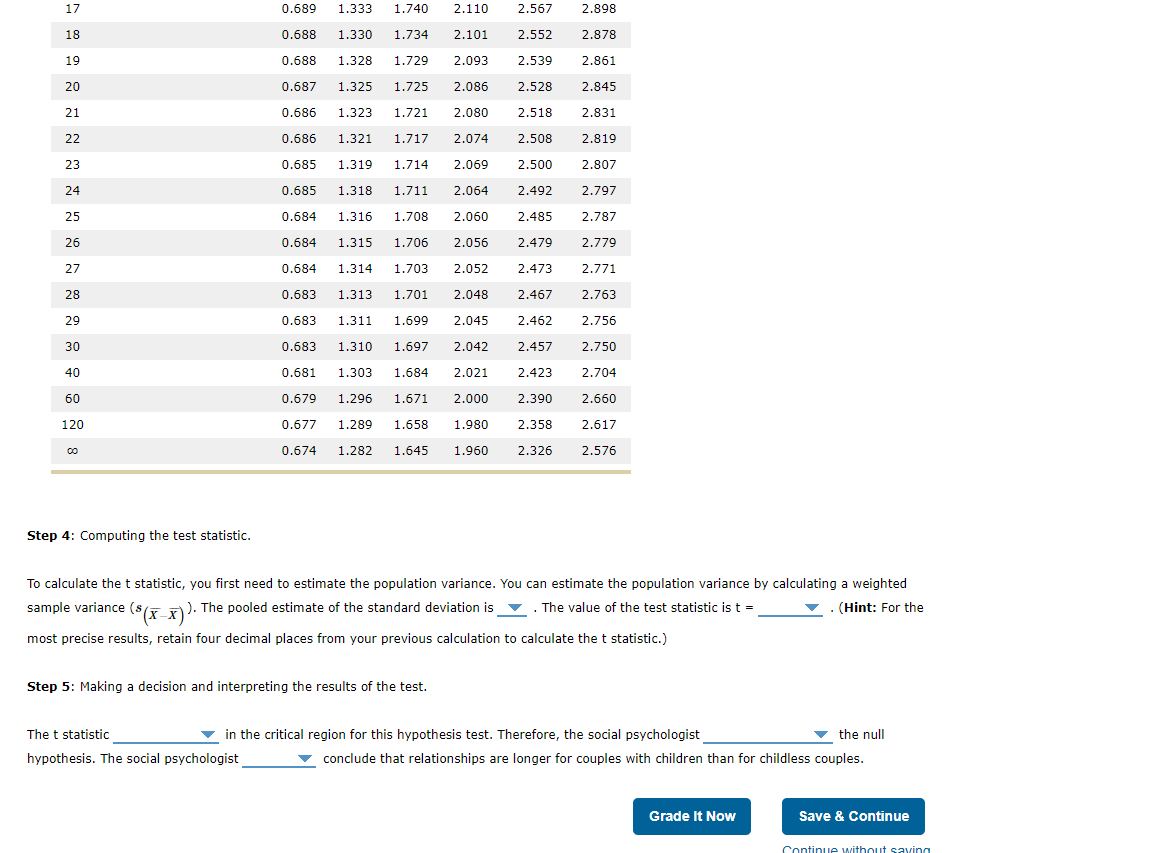
Use the t distribution table that follows to find the critical t-score, the value for a t-score that separates the tail from the main body of the distribution, forming the critical region. To use the table, you will first need to calculate the degrees of freedom (df). The degrees of freedom are choices are 48, 69, 22, 27. With = 0.05, the critical t-score is choices are 1.645, 1.671, 2.010 .
Step 4: Computing the test statistic.
To calculate the t statistic, you first need to estimate the population variance. You can estimate the population variance by calculating a weighted sample variance (s(XX)sXX). The pooled estimate of the standard deviation is choices are 4.30, 2.41, 6.75, 8.50. The value of the test statistic is t = choices are 2.32, 0.51, 2.09, 9.54. (Hint: For the most precise results, retain four decimal places from your previous calculation to calculate the t statistic.)
Step 5: Making a decision and interpreting the results of the test.
The t statistic choices are lies and does not lie? in the critical region for this hypothesis test. Therefore, the social psychologist ____ choices are does not reject or rejects the null hypothesis. The social psychologis ______ choices are can or cannot? conclude that relationships are longer for couples with children than for childless couples.
3. Hypothesis testing with sample means (small samples) Most engaged couples expect or at least hope they will have high levels of marital longevity. However, because 54% of first marriages end in divorce, social scientists have begun investigating influences on marital longevity. (Data source: These data were obtained from the National Center for Health Statistics.) Suppose social psychologist sets out to study the role of having children in marital longevity. She measures marital longevity in a random sample of couples with children and in a random sample of childless couples and compares the data. Assume that marital longevity is normally distributed and that the variance in longevity is approximately the same among couples with children as among childless couples. Step 1: Do the data meet the test requirements? A. Is there independent random sampling? O Yes O No B. What is the level of measurement of the variables? O Ordinal O Interval-ratio O Nominal C. Is the sampling distribution normally distributed? O No O Yes Step 2: State the null hypothesis. The social psychologist thinks that couples with children will have greater relationship longevity than childless couples. Identify the null and research hypotheses: HO: kako H. This is a -tailed test. Step 3: Select the sampling distribution and establish the critical region. The social psychologist collects data from one sample of couples with children and another of childless couples. With small samples, the t distribution is used to establish the critical region because the combined less than 100. Marital Longevity Couples with Children X = 28.7 years $i = 11 years N1 = 33 Childless Couples X 2 = 23.1 years S2 = 9 years N2 = 38 Use the t distribution table that follows to find the critical t-score, the value for a t-score that separates the tail from the main body of the distribution, forming the critical region. To use the table, you will first need to calculate the degrees of freedom (df). The degrees of freedom are . With a = 0.05, the critical t-score is 0.25 0.10 0.05 0.025 0.01 0.005 Proportion in One Tail Proportion in Two Tails df 0.50 0.20 0.10 0.05 0.01 0.02 31.821 1 1.000 3.078 6.314 12.706 63.657 2 0.816 1.886 2.920 4.303 6.965 9.925 3 0.765 1.638 2.353 3.182 4.541 5.841 4 0.741 1.533 2.132 2.776 3.747 4.604 5 0.727 1.476 2.015 2.571 3.365 4.032 6 0.718 1.440 1.943 2.447 3.143 3.707 7 0.711 1.415 1.895 2.365 2.998 3.499 8 0.706 1.397 1.860 2.306 2.896 3.355 9 9 0.703 1.383 1.833 2.262 2.821 3.250 10 0.700 1.372 1.812 2.228 2.764 3.169 11 0.697 1.363 1.796 2.201 2.718 3.106 12 0.695 1.356 1.782 2.179 2.681 3.055 13 0.694 1.350 1.771 2.160 2.650 3.012 14 0.692 1.345 1.761 2.145 2.624 2.977 15 0.691 1.341 1.753 2.131 2.602 2.947 16 0.690 1.337 1.746 2.120 2.583 2.921 17 0.689 1.333 1.740 2.110 2.567 2.898 17 0.689 1.333 1.740 2.110 2.567 2.898 18 0.688 1.330 1.734 2.101 2.552 2.878 19 0.688 1.328 1.729 2.093 2.539 2.861 20 0.687 1.325 1.725 2.086 2.528 2.845 21 0.686 1.323 1.721 2.080 2.518 2.831 22 0.686 1.321 1.717 2.074 2.508 2.819 23 0.685 1.319 1.714 2.069 2.500 2.807 24 0.685 1.318 1.711 2.064 2.492 2.797 25 0.684 1.316 1.708 2.060 2.787 2.485 2.479 26 0.684 1.315 1.706 2.056 2.779 27 0.684 1.314 1.703 2.052 2.473 2.771 28 0.683 1.313 1.701 2.048 2.467 2.763 29 0.683 1.311 1.699 2.045 2.462 2.756 30 0.683 1.310 1.697 2.042 2.457 2.750 40 0.681 1.303 1.684 2.021 2.423 2.704 60 0.679 1.296 1.671 2.000 2.390 2.660 120 0.677 1.289 1.658 1.980 2.358 2.617 0.674 1.282 1.645 1.960 2.326 2.576 Step 4: Computing the test statistic. To calculate the t statistic, you first need to estimate the population variance. You can estimate the population variance by calculating a weighted ). The pooled estimate of the standard deviation is . The value of the test statistic is t = (Hint: For the sample variance (*(*_)). The pooled estimate of the standard deviation is - most precise results, retain four decimal places from your previous calculation to calculate the t statistic.) Step 5: Making a decision and interpreting the results of the test. The t statistic in the critical region for this hypothesis test. Therefore, the social psychologist the null hypothesis. The social psychologist conclude that relationships are longer for couples with children than for childless couples. Grade It Now Save & Continue Continue without saving 3. Hypothesis testing with sample means (small samples) Most engaged couples expect or at least hope they will have high levels of marital longevity. However, because 54% of first marriages end in divorce, social scientists have begun investigating influences on marital longevity. (Data source: These data were obtained from the National Center for Health Statistics.) Suppose social psychologist sets out to study the role of having children in marital longevity. She measures marital longevity in a random sample of couples with children and in a random sample of childless couples and compares the data. Assume that marital longevity is normally distributed and that the variance in longevity is approximately the same among couples with children as among childless couples. Step 1: Do the data meet the test requirements? A. Is there independent random sampling? O Yes O No B. What is the level of measurement of the variables? O Ordinal O Interval-ratio O Nominal C. Is the sampling distribution normally distributed? O No O Yes Step 2: State the null hypothesis. The social psychologist thinks that couples with children will have greater relationship longevity than childless couples. Identify the null and research hypotheses: HO: kako H. This is a -tailed test. Step 3: Select the sampling distribution and establish the critical region. The social psychologist collects data from one sample of couples with children and another of childless couples. With small samples, the t distribution is used to establish the critical region because the combined less than 100. Marital Longevity Couples with Children X = 28.7 years $i = 11 years N1 = 33 Childless Couples X 2 = 23.1 years S2 = 9 years N2 = 38 Use the t distribution table that follows to find the critical t-score, the value for a t-score that separates the tail from the main body of the distribution, forming the critical region. To use the table, you will first need to calculate the degrees of freedom (df). The degrees of freedom are . With a = 0.05, the critical t-score is 0.25 0.10 0.05 0.025 0.01 0.005 Proportion in One Tail Proportion in Two Tails df 0.50 0.20 0.10 0.05 0.01 0.02 31.821 1 1.000 3.078 6.314 12.706 63.657 2 0.816 1.886 2.920 4.303 6.965 9.925 3 0.765 1.638 2.353 3.182 4.541 5.841 4 0.741 1.533 2.132 2.776 3.747 4.604 5 0.727 1.476 2.015 2.571 3.365 4.032 6 0.718 1.440 1.943 2.447 3.143 3.707 7 0.711 1.415 1.895 2.365 2.998 3.499 8 0.706 1.397 1.860 2.306 2.896 3.355 9 9 0.703 1.383 1.833 2.262 2.821 3.250 10 0.700 1.372 1.812 2.228 2.764 3.169 11 0.697 1.363 1.796 2.201 2.718 3.106 12 0.695 1.356 1.782 2.179 2.681 3.055 13 0.694 1.350 1.771 2.160 2.650 3.012 14 0.692 1.345 1.761 2.145 2.624 2.977 15 0.691 1.341 1.753 2.131 2.602 2.947 16 0.690 1.337 1.746 2.120 2.583 2.921 17 0.689 1.333 1.740 2.110 2.567 2.898 17 0.689 1.333 1.740 2.110 2.567 2.898 18 0.688 1.330 1.734 2.101 2.552 2.878 19 0.688 1.328 1.729 2.093 2.539 2.861 20 0.687 1.325 1.725 2.086 2.528 2.845 21 0.686 1.323 1.721 2.080 2.518 2.831 22 0.686 1.321 1.717 2.074 2.508 2.819 23 0.685 1.319 1.714 2.069 2.500 2.807 24 0.685 1.318 1.711 2.064 2.492 2.797 25 0.684 1.316 1.708 2.060 2.787 2.485 2.479 26 0.684 1.315 1.706 2.056 2.779 27 0.684 1.314 1.703 2.052 2.473 2.771 28 0.683 1.313 1.701 2.048 2.467 2.763 29 0.683 1.311 1.699 2.045 2.462 2.756 30 0.683 1.310 1.697 2.042 2.457 2.750 40 0.681 1.303 1.684 2.021 2.423 2.704 60 0.679 1.296 1.671 2.000 2.390 2.660 120 0.677 1.289 1.658 1.980 2.358 2.617 0.674 1.282 1.645 1.960 2.326 2.576 Step 4: Computing the test statistic. To calculate the t statistic, you first need to estimate the population variance. You can estimate the population variance by calculating a weighted ). The pooled estimate of the standard deviation is . The value of the test statistic is t = (Hint: For the sample variance (*(*_)). The pooled estimate of the standard deviation is - most precise results, retain four decimal places from your previous calculation to calculate the t statistic.) Step 5: Making a decision and interpreting the results of the test. The t statistic in the critical region for this hypothesis test. Therefore, the social psychologist the null hypothesis. The social psychologist conclude that relationships are longer for couples with children than for childless couples. Grade It Now Save & Continue Continue without saving
Step by Step Solution
There are 3 Steps involved in it

Get step-by-step solutions from verified subject matter experts