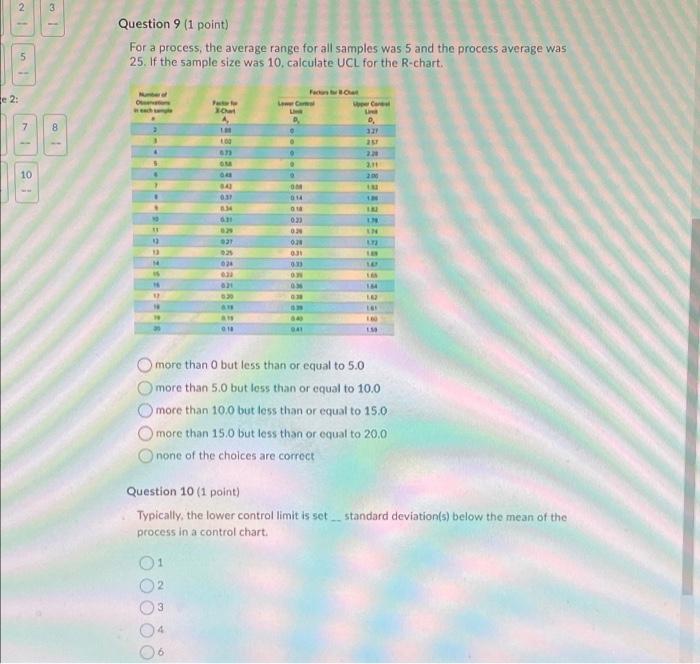
Question: 3 IN Question 9 (1 point) For a process, the average range for all samples was 5 and the process average was 25. If the

3 IN Question 9 (1 point) For a process, the
3 IN Question 9 (1 point) For a process, the average range for all samples was 5 and the process average was 25. If the sample size was 10, calculate UCL for the R-chart. de 2: Focus www word 0 32 8 . 10 200 3880333333333333333 OM 014 18 023 0:20 031 33 ON 0 14 27 160 more than 0 but less than or equal to 5.0 more than 5.0 but less than or equal to 10.0 more than 100 but less than or equal to 15.0 more than 15. but less than or equal to 20,0 none of the choices are correct Question 10 (1 point) Typically, the lower controllimit is set process in a control chart standard deviation(s) below the mean of the 2 3

Step by Step Solution

There are 3 Steps involved in it

1 Expert Approved Answer
Step: 1 Unlock blur-text-image
Question Has Been Solved by an Expert!

Get step-by-step solutions from verified subject matter experts

Step: 2 Unlock
Step: 3 Unlock

Students Have Also Explored These Related General Management Questions!