

Question: 3. Inflation Modeling How to work with data adjusted for inflation? What are the pitfalls for not adjusting for inflation? This question is aimed at

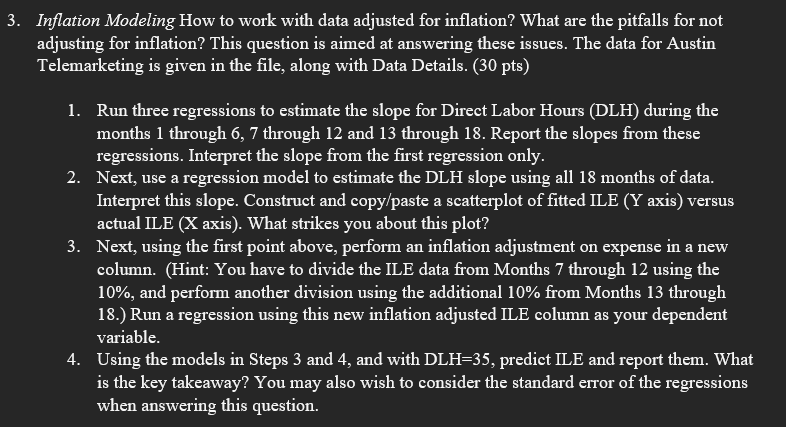
3. Inflation Modeling How to work with data adjusted for inflation? What are the pitfalls for not adjusting for inflation? This question is aimed at answering these issues. The data for Austin Telemarketing is given in the file, along with Data Details. (30 pts) 1. Run three regressions to estimate the slope for Direct Labor Hours (DLH) during the months 1 through 6, 7 through 12 and 13 through 18. Report the slopes from these regressions. Interpret the slope from the first regression only 2. Next, use a regression model to estimate the DLH slope using all 18 months of data. Interpret this slope. Construct and copy paste a scatterplot of fitted ILE (Y axis) versus actual ILE (X axis). What strikes you about this plot? 3. Next, using the first point above, perform an inflation adjustment on expense in a new column. (Hint: You have to divide the ILE data from Months 7 through 12 using the 10%, and perform another division using the additional 10% from Months 13 through 18.) Run a regression using this new inflation adjusted ILE column as your dependent variable. 4. Using the models in Steps 3 and 4, and with DLH=35, predict ILE and report them. What is the key takeaway? You may also wish to consider the standard error of the regressions when answering this
Step by Step Solution
There are 3 Steps involved in it

Get step-by-step solutions from verified subject matter experts