

Question: 3. Insert SPSS graph here: 4. Include write up with complete statistical notation with interpretation. If significant, state how. If not significant, what does

3. Insert SPSS graph here:
4. Include write up with complete statistical notation with interpretation. If significant, state how. If not significant, what does that mean in layman's terms?

8. Insert SPSS graph here:
9. Include write up with complete statistical notation with interpretation. If significant, state how. If not significant, what does that mean in layman's terms?


12. Insert SPSS graph here:
13. Include write up with complete statistical notation with interpretation. If significant, state how. If not significant, what does that mean in layman's terms?
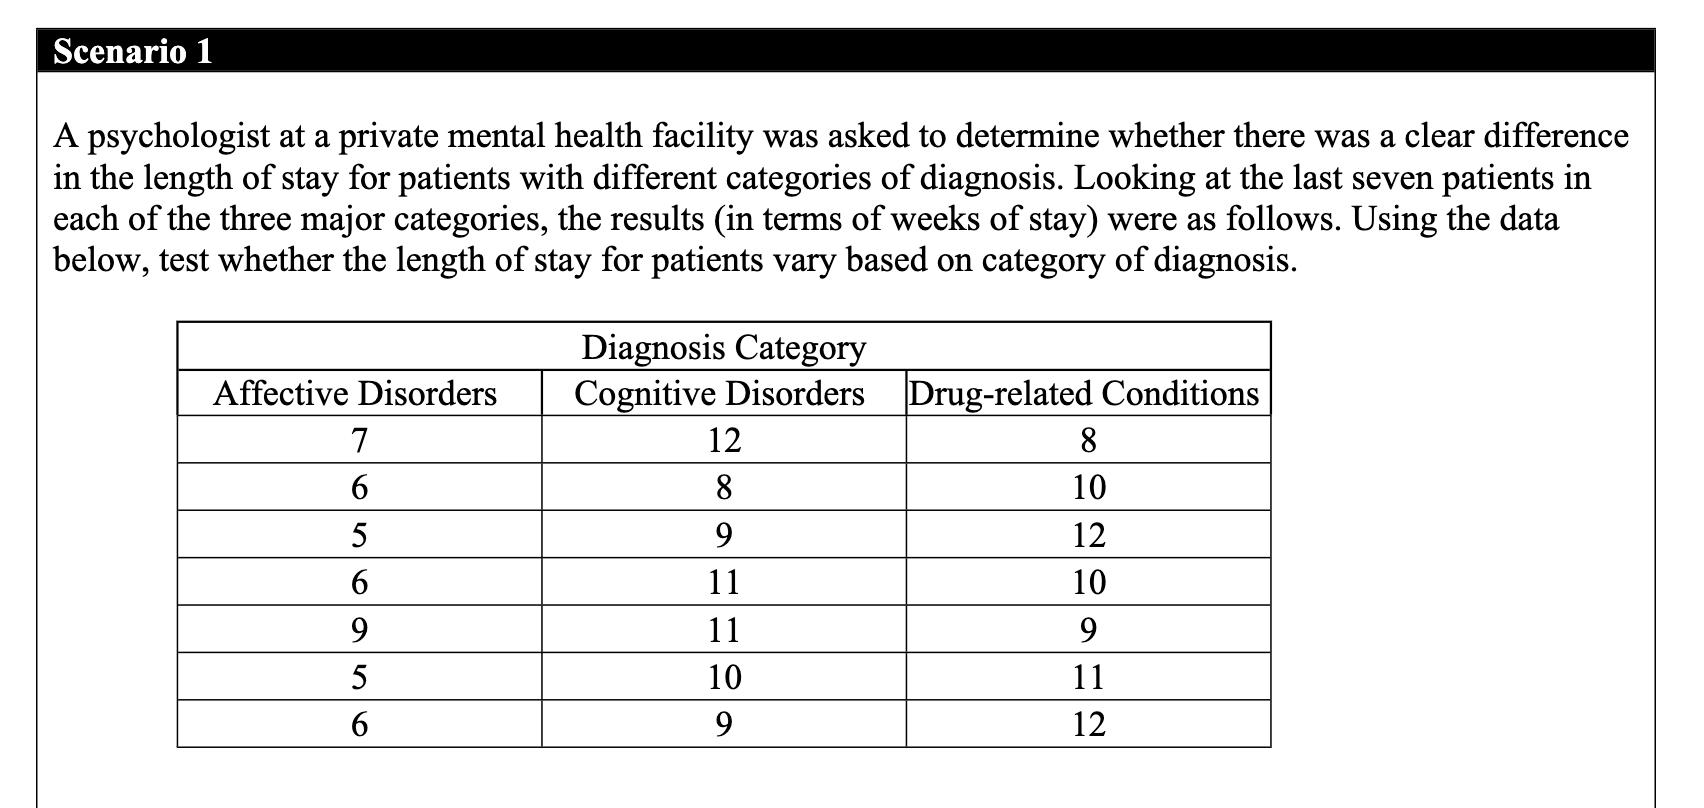
Scenario 1 A psychologist at a private mental health facility was asked to determine whether there was a clear difference in the length of stay for patients with different categories of diagnosis. Looking at the last seven patients in each of the three major categories, the results (in terms of weeks of stay) were as follows. Using the data below, test whether the length of stay for patients vary based on category of diagnosis. Diagnosis Category Affective Disorders Cognitive Disorders Drug-related Conditions 7 12 8 6 8 10 5 9 12 6 11 10 9 11 9 5 10 11 6 9 12
Step by Step Solution
There are 3 Steps involved in it

Get step-by-step solutions from verified subject matter experts