

Question: 3. (IO points) The historical demand data is provided in the first two columns of Table A Table A: Historical demand a. After plotting demand
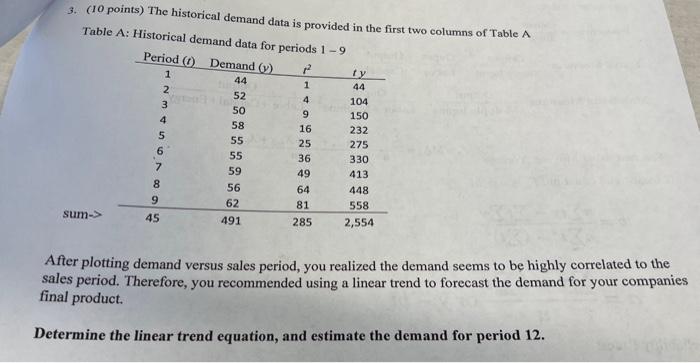
3. (IO points) The historical demand data is provided in the first two columns of Table A Table A: Historical demand a. After plotting demand versus sales period, you realized the demand seems to be highly correlated to the sales period. Therefore, you recommended using a linear trend to forecast the demand for your companies final product. Determine the linear trend equation, and estimate the demand for period 12
Step by Step Solution
There are 3 Steps involved in it
1 Expert Approved Answer
Step: 1 Unlock

Question Has Been Solved by an Expert!
Get step-by-step solutions from verified subject matter experts
Step: 2 Unlock
Step: 3 Unlock