

Question: 3. Let X have a Gaussian density function p(x) with parameters u and o. Write a MATLAB function called gauss_plot.m (using the template below) that
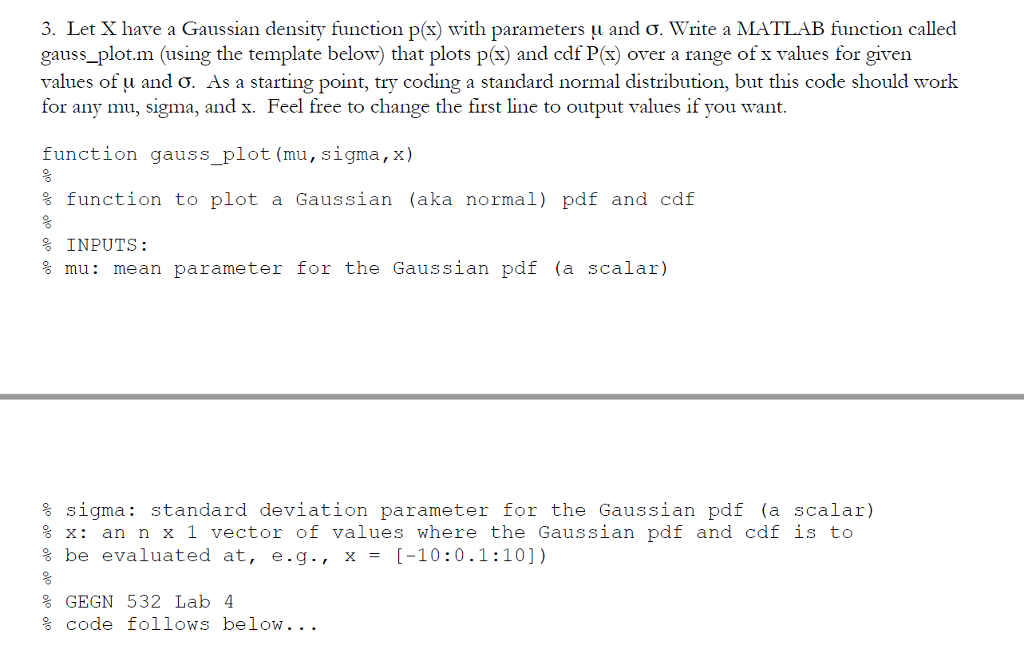
3. Let X have a Gaussian density function p(x) with parameters u and o. Write a MATLAB function called gauss_plot.m (using the template below) that plots p(x) and cdf P(x) over a range of x values for given values of u and o. As a starting point, try coding a standard normal distribution, but this code should work for any mu, sigma, and x. Feel free to change the first line to output values if you want. function gauss plot (mu, sigma, x) % function to plot a Gaussian (aka normal) pdf and cdf % INPUTS: % mu: mean parameter for the Gaussian pdf (a scalar) % sigma: standard deviation parameter for the Gaussian pdf (a scalar) % x: an n x 1 vector of values where the Gaussian pdf and cdf is to % be evaluated at, e.g., x = (-10:0.1:10]). % GEGN 532 Lab 4 % code follows below
Step by Step Solution
There are 3 Steps involved in it

Get step-by-step solutions from verified subject matter experts