

Question: 3) Meena Chavan Corp.'s computer chip production process yields DRAM chips with an average life of 1,800 hours and o=100 hours. The tolerance upper
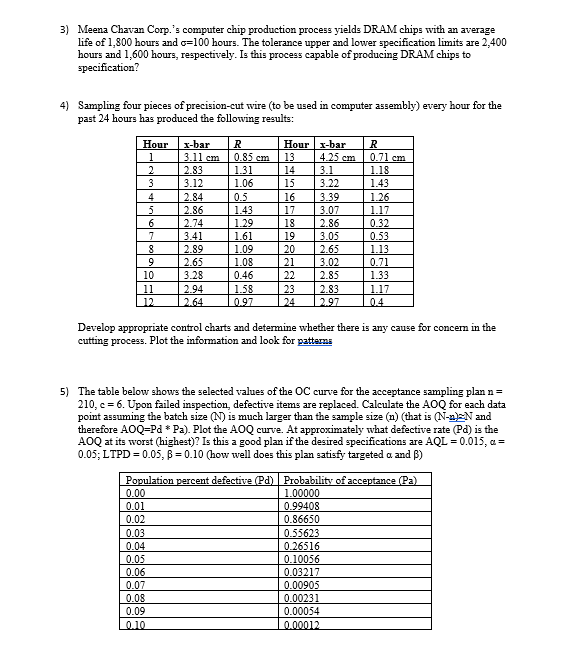
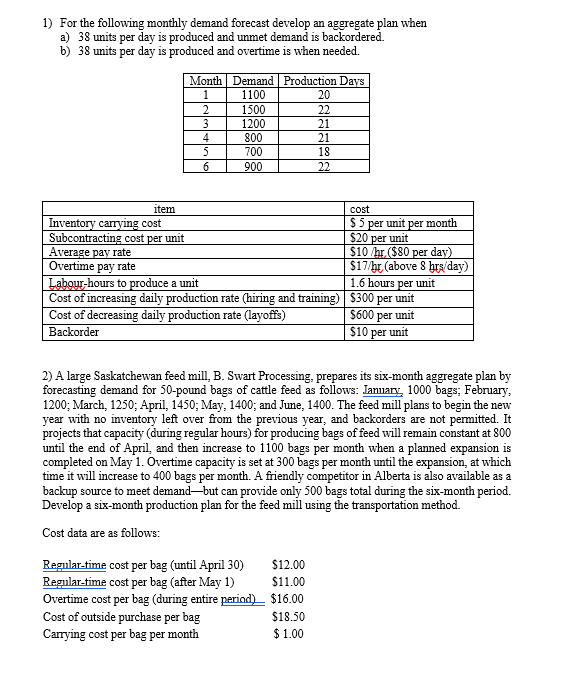
3) Meena Chavan Corp.'s computer chip production process yields DRAM chips with an average life of 1,800 hours and o=100 hours. The tolerance upper and lower specification limits are 2,400 hours and 1,600 hours, respectively. Is this process capable of producing DRAM chips to specification? 4) Sampling four pieces of precision-cut wire (to be used in computer assembly) every hour for the past 24 hours has produced the following results: Hour x-bar R Hour x-bar R 1 3.11 cm 0.85 cm 13 4.25 cm 0.71 cm 2 2.83 1.31 14 3.1 1.18 3 3.12 1.06 15 3.22 1.43 4 2.84 0.5 16 3.39 1.26 5 2.86 1.43 17 3.07 1.17 6 2.74 1.29 18 2.86 0.32 7 3.41 1.61 19 3.05 0.53 8 2.89 1.09 20 2.65 1.13 9 2.65 1.08 21 3.02 0.71 10 3.28 0.46 22 2.85 1.33 11 2.94 1.58 23 2.83 1.17 12 2.64 0.97 24 2.97 04 Develop appropriate control charts and determine whether there is any cause for concern in the cutting process. Plot the information and look for patterns 5) The table below shows the selected values of the OC curve for the acceptance sampling plan n = 210, c = 6. Upon failed inspection, defective items are replaced. Calculate the AOQ for each data point assuming the batch size (N) is much larger than the sample size (n) (that is (N-n)EN and therefore AOQ=Pd * Pa). Plot the AOQ curve. At approximately what defective rate (Pd) is the AOQ at its worst (highest)? Is this a good plan if the desired specifications are AQL = 0.015, a = 0.05; LTPD = 0.05, B = 0.10 (how well does this plan satisfy targeted a and ) Population percent defective (Pd) Probability of acceptance (Pa) 0.00 1.00000 0.01 0.99408 0.02 0.86650 0.03 0.55623 0.04 0.26516 0.05 0.10056 0.06 0.03217 0.07 0.00905 0.08 0.00231 0.09 0.00054 0.10 0.00012 1) For the following monthly demand forecast develop an aggregate plan when a) 38 units per day is produced and unmet demand is backordered. b) 38 units per day is produced and overtime is when needed. Month Demand Production Days 1 1100 20 2 1500 22 3 1200 21 4 800 21 5 700 18 6 900 22 item Inventory carrying cost Subcontracting cost per unit Average pay rate Overtime pay rate cost $5 per unit per month $20 per unit $10/hr ($80 per day) $17/hr (above 8 hrs/day) Labour-hours to produce a unit 1.6 hours per unit Cost of increasing daily production rate (hiring and training) Cost of decreasing daily production rate (layoffs) Backorder $300 per unit $600 per unit $10 per unit 2) A large Saskatchewan feed mill, B. Swart Processing, prepares its six-month aggregate plan by forecasting demand for 50-pound bags of cattle feed as follows: January, 1000 bags; February, 1200; March, 1250; April, 1450; May, 1400; and June, 1400. The feed mill plans to begin the new year with no inventory left over from the previous year, and backorders are not permitted. It projects that capacity (during regular hours) for producing bags of feed will remain constant at 800 until the end of April, and then increase to 1100 bags per month when a planned expansion is completed on May 1. Overtime capacity is set at 300 bags per month until the expansion, at which time it will increase to 400 bags per month. A friendly competitor in Alberta is also available as a backup source to meet demand-but can provide only 500 bags total during the six-month period. Develop a six-month production plan for the feed mill using the transportation method. Cost data are as follows: Regular-time cost per bag (until April 30) $12.00 Regular-time cost per bag (after May 1) $11.00 Overtime cost per bag (during entire period) $16.00 Cost of outside purchase per bag $18.50 Carrying cost per bag per month $1.00
Step by Step Solution
There are 3 Steps involved in it

Get step-by-step solutions from verified subject matter experts