

Question: 3 . Modify the Monte Carlo simulation program provided to answer the following questions: ( a ) Plot a histogram of the net revenues. (
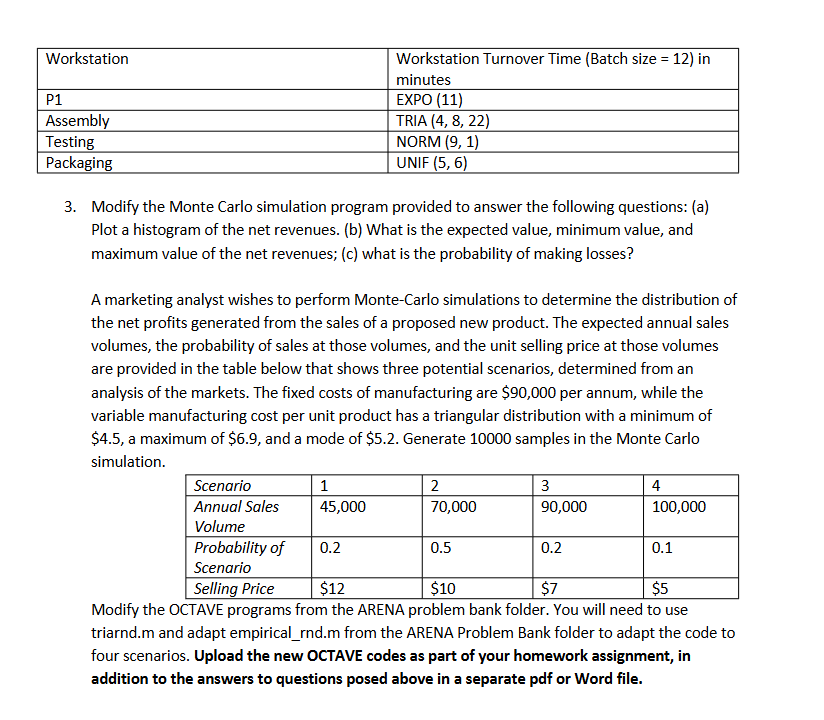
Modify the Monte Carlo simulation program provided to answer the following questions: a Plot a histogram of the net revenues. b What is the expected value, minimum value, and maximum value of the net revenues; c what is the probability of making losses?
A marketing analyst wishes to perform MonteCarlo simulations to determine the distribution of the net profits generated from the sales of a proposed new product. The expected annual sales volumes, the probability of sales at those volumes, and the unit selling price at those volumes are provided in the table below that shows three potential scenarios, determined from an analysis of the markets. The fixed costs of manufacturing are $ per annum, while the variable manufacturing cost per unit product has a triangular distribution with a minimum of $ a maximum of $ and a mode of $ Generate samples in the Monte Carlo simulation.
Modify the OCTAVE programs from the ARENA problem bank folder. You will need to use triarnd.m and adapt empiricalrndm from the ARENA Problem Bank folder to adapt the code to four scenarios. Upload the new OCTAVE codes as part of your homework assignment, in addition to the answers to questions posed above in a separate pdf or Word file.
Step by Step Solution
There are 3 Steps involved in it
1 Expert Approved Answer
Step: 1 Unlock

Question Has Been Solved by an Expert!
Get step-by-step solutions from verified subject matter experts
Step: 2 Unlock
Step: 3 Unlock