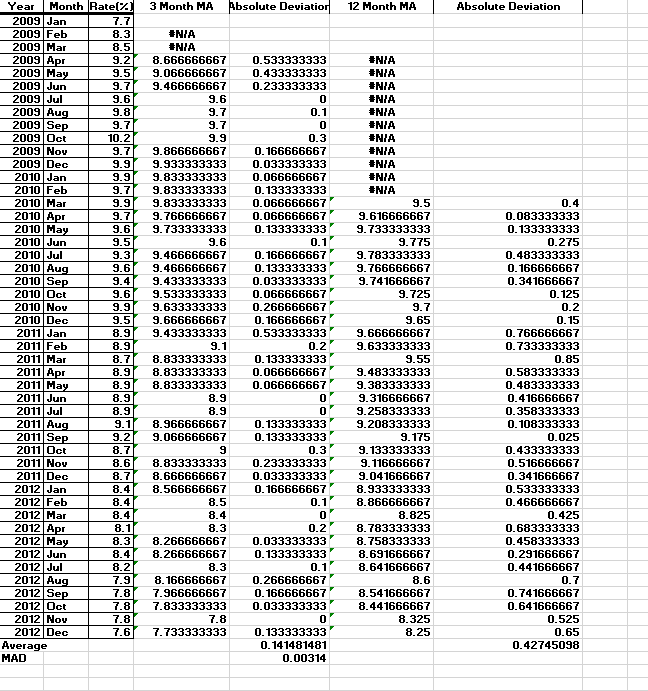
Question: 3 Month MA Absolute Deviatior 12 Month MA Absolute Deviation Year Month Rate(%) 2009 Jan 7.7 2009 Feb 8.3 2009 Mar 8.5 2009 Apr 9.2

3 Month MA Absolute Deviatior 12 Month MA3 Month MA Absolute Deviatior 12 Month MA

3 Month MA Absolute Deviatior 12 Month MA Absolute Deviation Year Month Rate(%) 2009 Jan 7.7 2009 Feb 8.3 2009 Mar 8.5 2009 Apr 9.2 2009 May 9.5 2009 Jun 9.7 2009 Jul 9.6 2009 Aug 9.8 2009 Sep 9.7 2009 Oct 10.2 2009 Nov 9.7 2009 Dec 9.9 2010 Jan 9.9 2010 Feb 9.7 2010 Mar 9.9 2010 Apr 9.7 2010 May 9.6 2010 Jun 9.5 2010 Jul 9.3 2010 Aug 9.6 2010 Sep 9.4 2010 Oct 9.6 2010 Nov 9.9 2010 Dec 9.5 2011 Jan 8.9 2011 Feb 8.9 2011 Mar 8.7 2011 Apr 8.9 2011 May 8.9 2011 Jun 8.9 2011 Jul 8.9 2011 Aug 9.1 2011 Sep 9.2 2011 Oct 8.7 2011 Nov 8.6 2011 Dec 8.7 2012 Jan 8.4 2012 Feb 8.4 2012 Mar 8.4 2012 Apr 8.1 2012 May 8.3 2012 Jun 8.4 2012 Jul 8.2 2012 Aug 7.9 2012 Sep 7.8 2012 Oct 7.8 2012 Nov 7.8 2012 Dec 7.6 Average MAD #N/A #N/A 8.666666667 9.066666667 9.466666667 9.6 9.7 9.7 9.9 9.866666667 9.933333333 9.833333333 9.833333333 9.833333333 9.766666667 9.733333333 9.6 9.466666667 9.466666667 9.433333333 9.533333333 9.633333333 9.666666667 9.433333333 9.1 8.833333333 8.833333333 8.833333333 8.9 8.9 8.966666667 9.066666667 9 8.833333333 8.666666667 8.566666667 8.5 8.4 8.3 8.266666667 8.266666667 8.3 8.166666667 7.966666667 7.833333333 7.8 7.733333333 0.533333333 0.433333333 0.233333333 0 0.1 0 0.3 0.166666667 0.033333333 0.066666667 0.133333333 0.066666667 0.066666667 0.133333333 0.1 0.166666667 0.133333333 0.033333333 0.066666667 0.266666667 0.166666667 0.533333333 0.2 0.133333333 0.066666667 0.066666667 0 0 0.133333333 0.133333333 0.3 0.233333333 0.033333333 0.166666667 0.1 0 0.2 0.033333333 0.133333333 0.1 0.266666667 0.166666667 0.033333333 0 0.133333333 0.141481481 0.00314 TOP WALLPAPER #NIA #N/A #NIA #N/A INIA #N/A #N/A #N/A #N/A #NIA #N/A 9.5 9.616666667 9.733333333 9.775 9.783333333 9.766666667 9.741666667 9.725 9.7 9.65 9.666666667 9.633333333 9.55 9.483333333 9.383333333 9.316666667 9.258333333 9.208333333 9.175 9.133333333 9.116666667 9.041666667 8.933333333 8.866666667 8.825 8.783333333 8.758333333 8.691666667 8.641666667 8.6 8.541666667 8.441666667 8.325 8.25 0.4 0.083333333 0.133333333 0.275 0.483333333 0.166666667 0.341666667 0.125 0.2 0.15 0.766666667 0.733333333 0.85 0.583333333 0.483333333 0.416666667 0.358333333 0.108333333 0.025 0.433333333 0.516666667 0.341666667 0.533333333 0.466666667 0.425 0.683333333 0.458333333 0.291666667 0.441666667 0.7 0.741666667 0.641666667 0.525 0.65 0.42745098 The accompanying dataset provides data on monthly unemployment rates for a certain region over four years. Compare 3- and 12-month moving average forecasts using the MAD criterion. Which of the two models yields better results? Explain. Click the icon to view the unemployment rate data. Find the MAD for the 3-month moving average forecast. MAD = >=(Type an integer or decimal rounded to three decimal places as needed.)

Step by Step Solution

There are 3 Steps involved in it

1 Expert Approved Answer
Step: 1 Unlock blur-text-image
Question Has Been Solved by an Expert!

Get step-by-step solutions from verified subject matter experts

Step: 2 Unlock
Step: 3 Unlock

Students Have Also Explored These Related General Management Questions!