

Question: 3. Mr. De Leon teaches Statistics at UPHSD. He recently wrote down the class marks for his current collegiate class and compared it to the
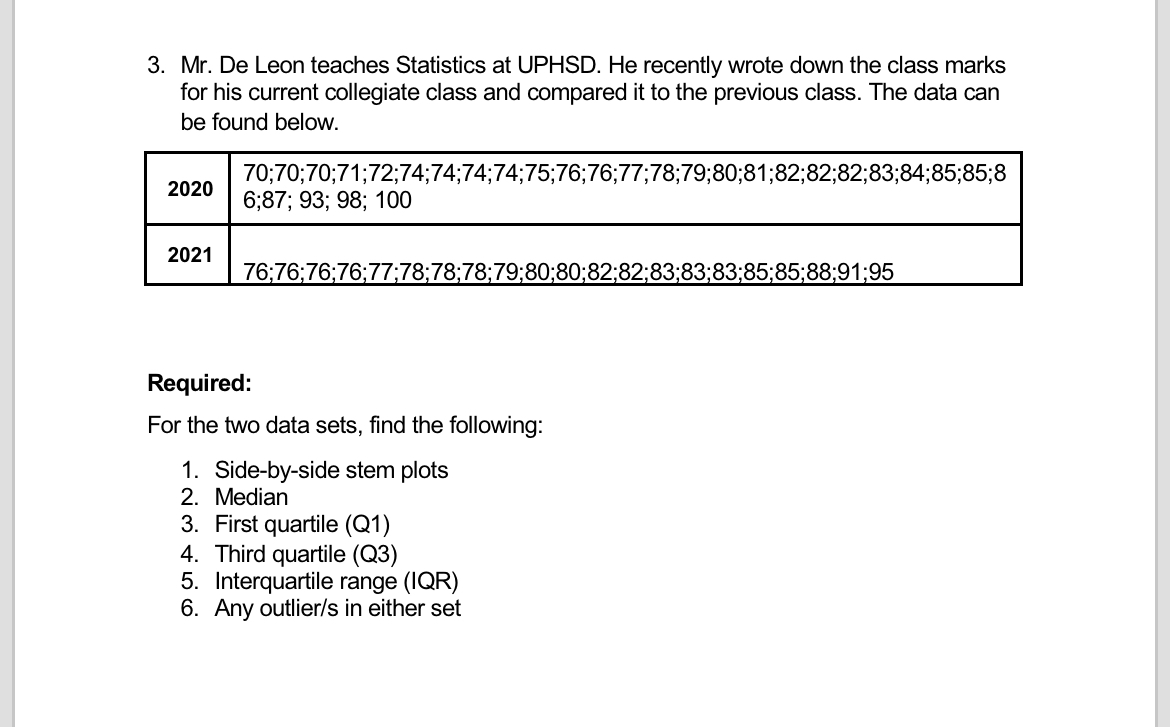
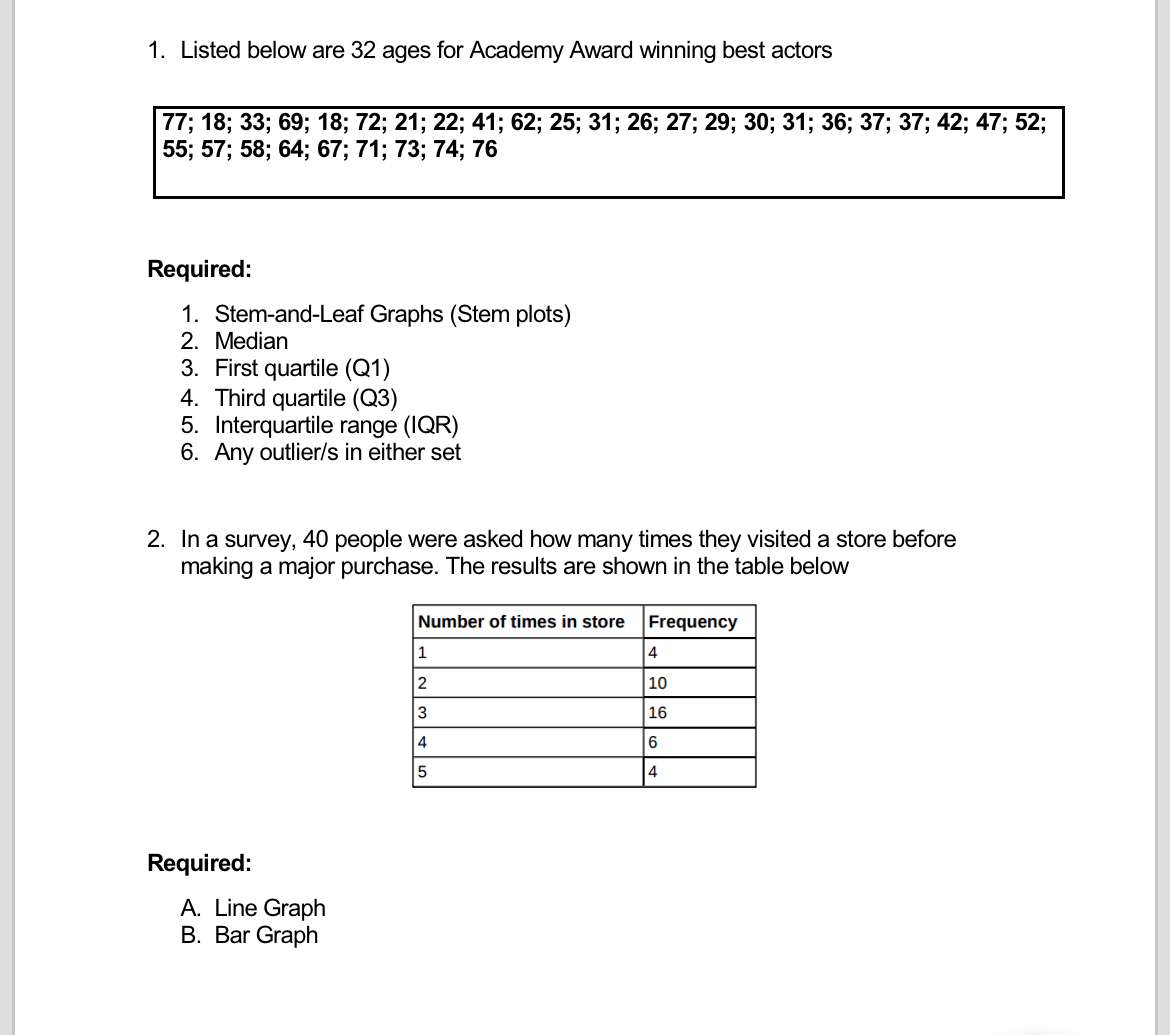


3. Mr. De Leon teaches Statistics at UPHSD. He recently wrote down the class marks for his current collegiate class and compared it to the previous class. The data can be found below. 70;70;70;71;72;74;74;74;74;75;76;76;77;78;79;80;81;82;82;82;83;84;85;85;8 2020 6;87; 93; 98; 100 2021 76;76;76;76;77;78;78;78;79;80;80;82;82;83;83;83;85;85;88:91;95 Required: For the two data sets, find the following: 1. Side-by-side stem plots 2. Median 3. First quartile (Q1) 4. Third quartile (Q3) 5. Interquartile range (IQR) 6. Any outlier/s in either set1. Listed below are 32 ages for Academy Award winning best actors 77; 18; 33; 69; 18; 72; 21; 22; 41; 62; 25; 31; 26; 27; 29; 30; 31; 36; 37; 37; 42; 47; 52; 55; 57; 58; 64; 67; 71; 73; 74; 76 Required: 1. Stem-and-Leaf Graphs (Stem plots) 2. Median 3. First quartile (Q1) 4. Third quartile (Q3) 5. Interquartile range (IQR) 6. Any outlier/s in either set 2. In a survey, 40 people were asked how many times they visited a store before making a major purchase. The results are shown in the table below Number of times in store Frequency 1 4 2 10 3 16 6 5 4 Required: A. Line Graph B. Bar Graph
Step by Step Solution
There are 3 Steps involved in it

Get step-by-step solutions from verified subject matter experts