

Question: = = 3. Numerical simulation. Consider the following Solow growth model: Yt = 10 * 10 * Jkt kt+1 = kt 0.1kt + 0.2yt ko
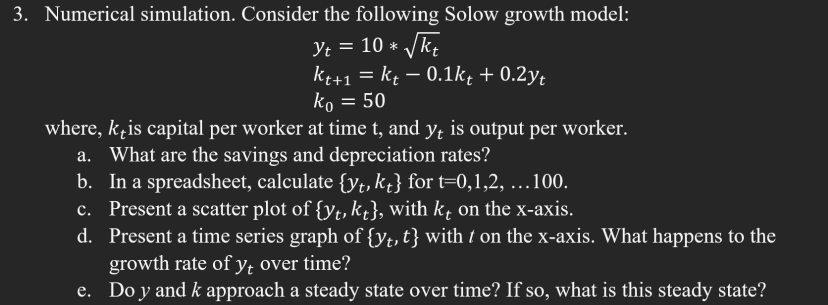
= = 3. Numerical simulation. Consider the following Solow growth model: Yt = 10 * 10 * Jkt kt+1 = kt 0.1kt + 0.2yt ko = 50 where, k4is capital per worker at time t, and yt is output per worker. What are the savings and depreciation rates? b. In a spreadsheet, calculate {yt, kt} for t=0,1,2, ...100. c. Present a scatter plot of {yt, kt}, with k on the x-axis. d. Present a time series graph of {yt, t} with t on the x-axis. What happens to the growth rate of yt over time? e. Do y and k approach a steady state over time? If so, what is this steady state? = = 3. Numerical simulation. Consider the following Solow growth model: Yt = 10 * 10 * Jkt kt+1 = kt 0.1kt + 0.2yt ko = 50 where, k4is capital per worker at time t, and yt is output per worker. What are the savings and depreciation rates? b. In a spreadsheet, calculate {yt, kt} for t=0,1,2, ...100. c. Present a scatter plot of {yt, kt}, with k on the x-axis. d. Present a time series graph of {yt, t} with t on the x-axis. What happens to the growth rate of yt over time? e. Do y and k approach a steady state over time? If so, what is this steady state
Step by Step Solution
There are 3 Steps involved in it

Get step-by-step solutions from verified subject matter experts