

Question: 3. On the Stock Comparison worksheet, create a line chart that compares all four stocks on the same chart. Use the following information to help
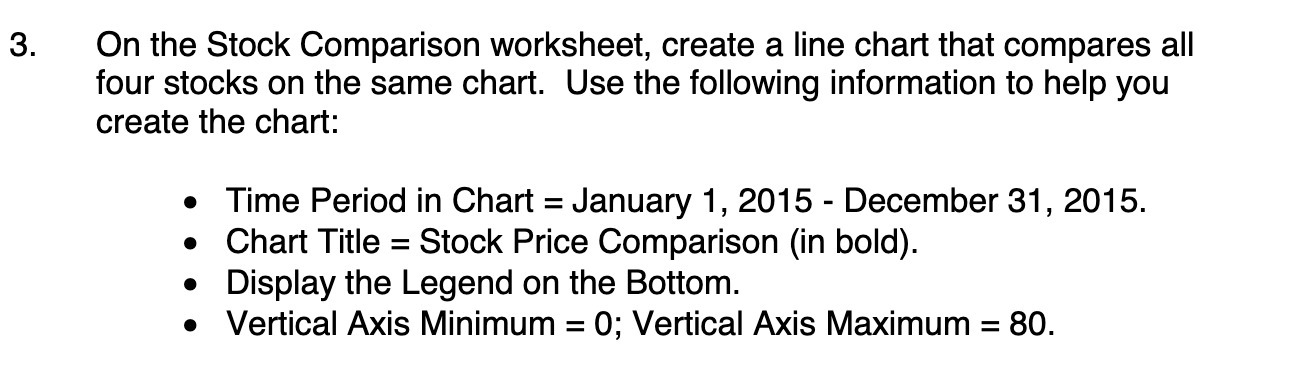
3. On the Stock Comparison worksheet, create a line chart that compares all four stocks on the same chart. Use the following information to help you create the chart: Time Period in Chart = January 1, 2015 - December 31, 2015. Chart Title = Stock Price Comparison (in bold). Display the Legend on the Bottom. Vertical Axis Minimum = 0; Vertical Axis Maximum = 80
Step by Step Solution
There are 3 Steps involved in it
1 Expert Approved Answer
Step: 1 Unlock

Question Has Been Solved by an Expert!
Get step-by-step solutions from verified subject matter experts
Step: 2 Unlock
Step: 3 Unlock