

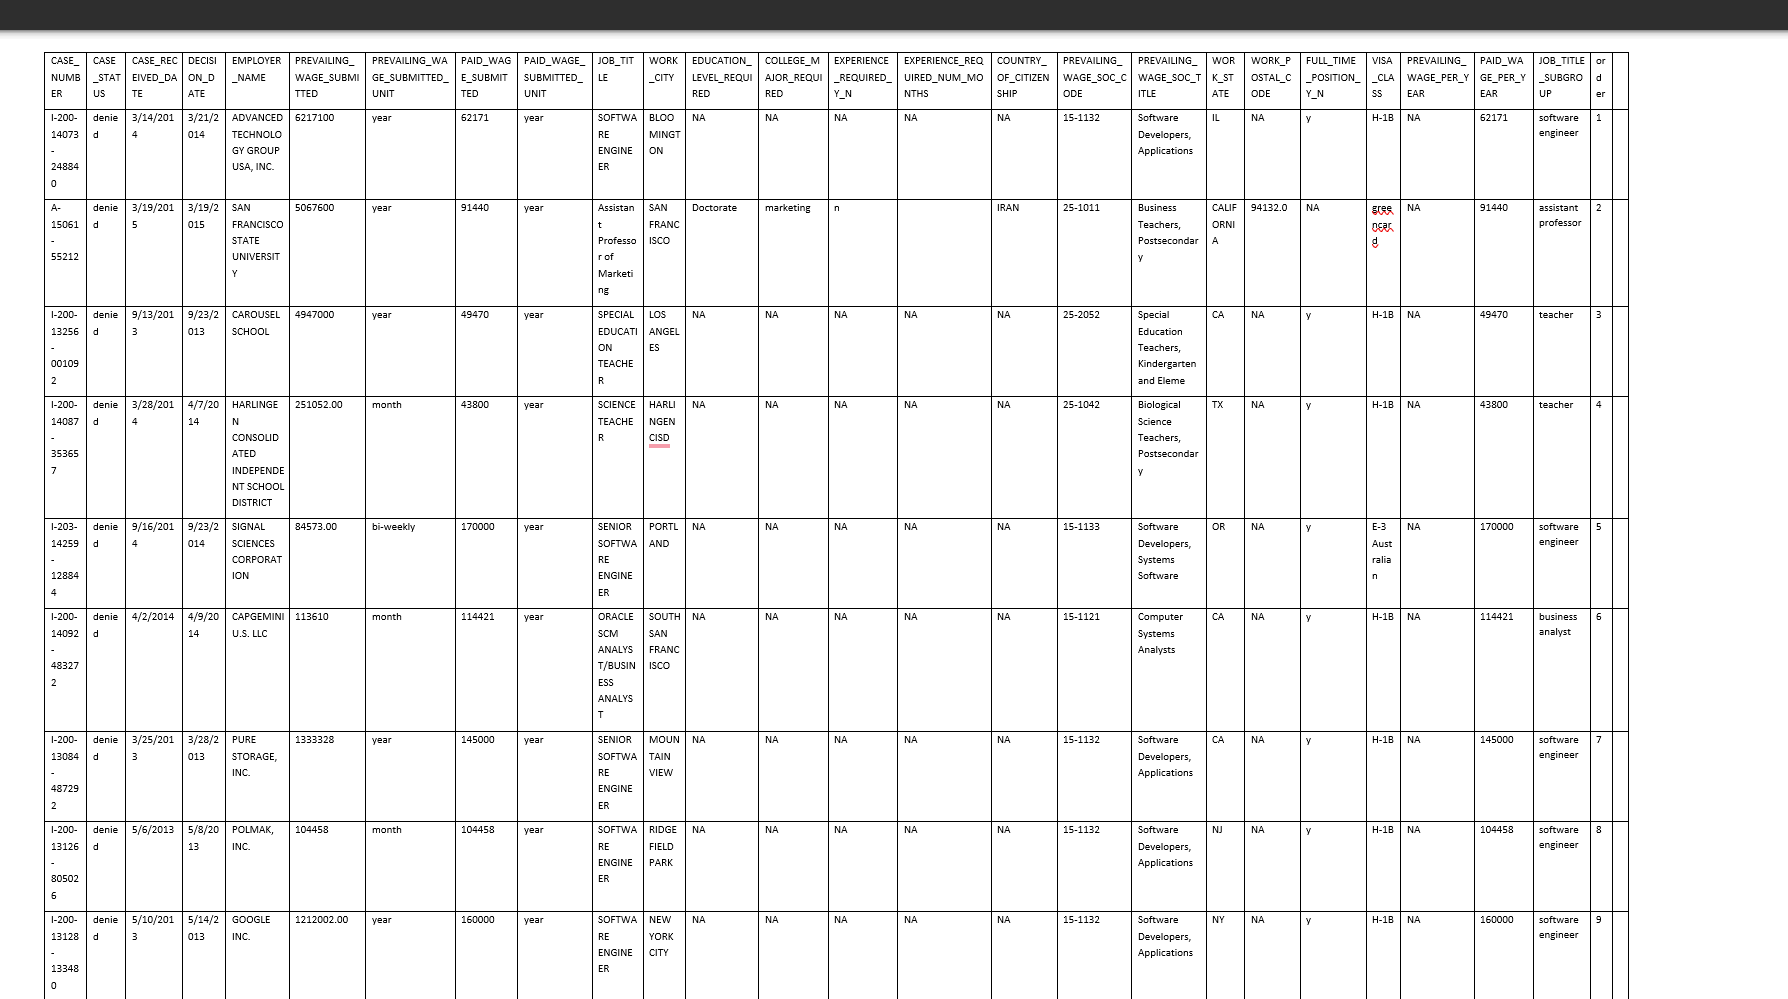
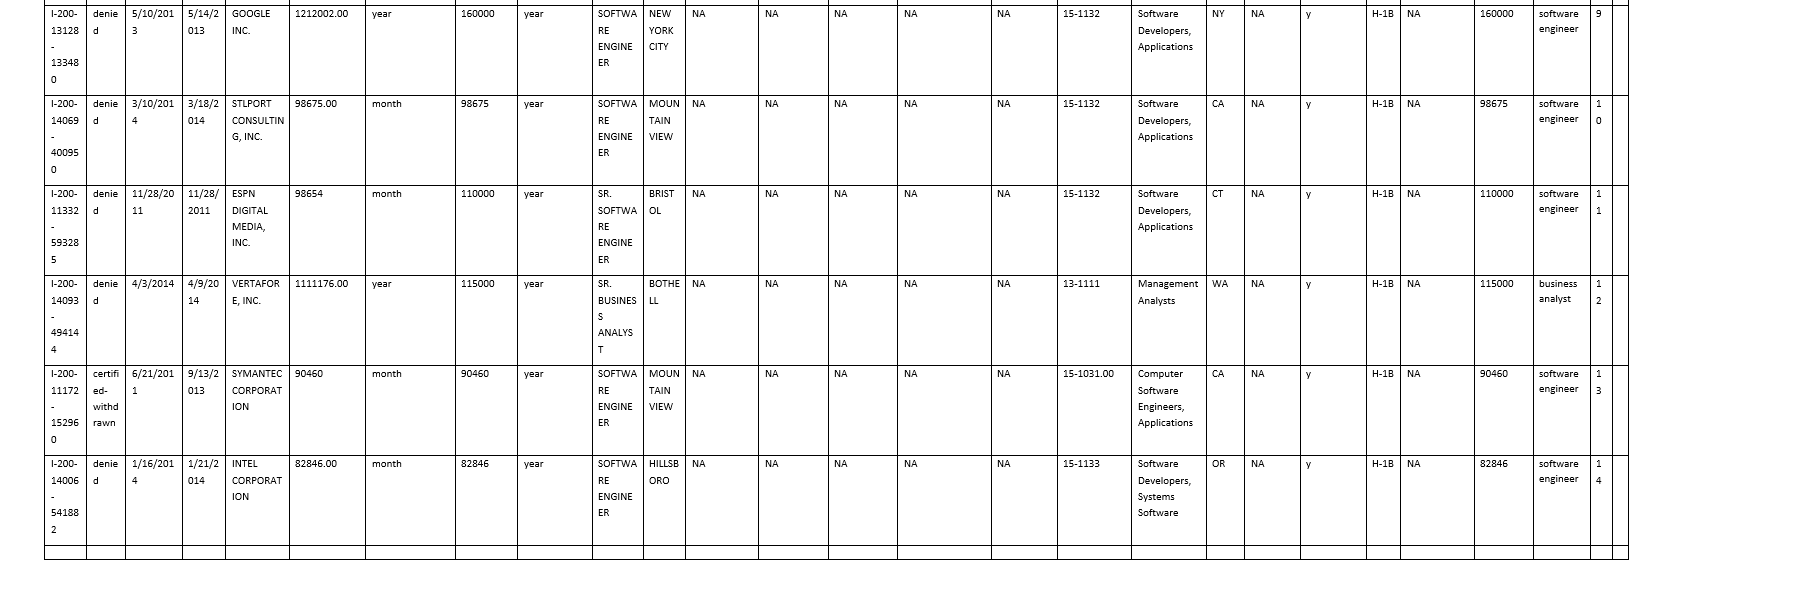
Question: 3. Open Sheet 1 and scan all dimensions and measure variables. 4. Convert Paid Wage Per Year and Prevailing Wage per Year from Dimensions to
3. Open Sheet 1 and scan all dimensions and measure variables.
4. Convert Paid Wage Per Year and Prevailing Wage per Year from Dimensions to Measures.
5. Now you are ready to do some data visualization and analysis tasks.
Deliverable -1
For this exercise, you will use Paid Wage Per Year as your Dependent variable. The Job Title Sub-group will be your Independent variable.
1 (a) Create a column chart showing the relationship between the above variables and sort them from highest to lowest wages. Note: use the Median value for Paid Wage Per Year while creating the graph.
- compare and show the general trend of paid wages of four data related job positions Business Analyst, Data Analyst, Data Scientist and Software Engineer. Filter the Job-Title Subgroup dimension to these four positions. 2. (a) Create line graphs for each of these 4 job title subgroups showing change in median wage per year from 2009 -2015, in a single visualization Hint: Use Job Title SubGroup, Case Received Date and Median Wage Per Year variables
2. (c) What change do you observe happening to the salaries for these four data-related jobs? Note your observation in the text entry box below.
Note; Please use tableau software to do it and show the process( Transform the picture to an excel file to be able to use it)
Step by Step Solution
There are 3 Steps involved in it

Get step-by-step solutions from verified subject matter experts