

Question: 3. Optimal Detection Verification (20 points): Continue to consider the above com- munication system, with Ho : X = ao + W, or H1 :
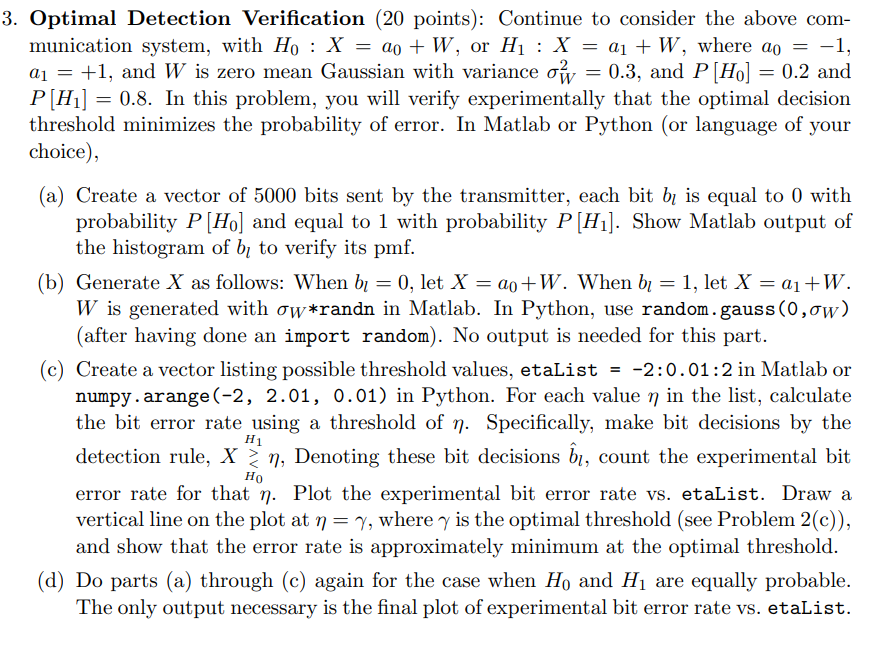
3. Optimal Detection Verification (20 points): Continue to consider the above com- munication system, with Ho : X = ao + W, or H1 : X = a1 + W, where ao = -1, a1 = +1, and W is zero mean Gaussian with variance ow = 0.3, and P [H.] = 0.2 and P[H] = 0.8. In this problem, you will verify experimentally that the optimal decision threshold minimizes the probability of error. In Matlab or Python (or language of your choice), (a) Create a vector of 5000 bits sent by the transmitter, each bit b is equal to 0 with probability P[H.] and equal to 1 with probability P[H]. Show Matlab output of the histogram of b to verify its pmf. (b) Generate X as follows: When b = 0, let X = ao+W. When b = 1, let X = a1 +W. W is generated with ow*randn in Matlab. In Python, use random.gauss(0,0w) (after having done an import random). No output is needed for this part. (c) Create a vector listing possible threshold values, etaList = -2:0.01:2 in Matlab or numpy.arange(-2, 2.01, 0.01) in Python. For each value n in the list, calculate the bit error rate using a threshold of n. Specifically, make bit decisions by the H1 detection rule, Xn, Denoting these bit decisions @i, count the experimental bit error rate for that n. Plot the experimental bit error rate vs. etaList. Draw a vertical line on the plot at n= y, where y is the optimal threshold (see Problem 2(c)), and show that the error rate is approximately minimum at the optimal threshold. (d) Do parts (a) through (c) again for the case when Ho and H are equally probable. The only output necessary is the final plot of experimental bit error rate vs. etaList. 3. Optimal Detection Verification (20 points): Continue to consider the above com- munication system, with Ho : X = ao + W, or H1 : X = a1 + W, where ao = -1, a1 = +1, and W is zero mean Gaussian with variance ow = 0.3, and P [H.] = 0.2 and P[H] = 0.8. In this problem, you will verify experimentally that the optimal decision threshold minimizes the probability of error. In Matlab or Python (or language of your choice), (a) Create a vector of 5000 bits sent by the transmitter, each bit b is equal to 0 with probability P[H.] and equal to 1 with probability P[H]. Show Matlab output of the histogram of b to verify its pmf. (b) Generate X as follows: When b = 0, let X = ao+W. When b = 1, let X = a1 +W. W is generated with ow*randn in Matlab. In Python, use random.gauss(0,0w) (after having done an import random). No output is needed for this part. (c) Create a vector listing possible threshold values, etaList = -2:0.01:2 in Matlab or numpy.arange(-2, 2.01, 0.01) in Python. For each value n in the list, calculate the bit error rate using a threshold of n. Specifically, make bit decisions by the H1 detection rule, Xn, Denoting these bit decisions @i, count the experimental bit error rate for that n. Plot the experimental bit error rate vs. etaList. Draw a vertical line on the plot at n= y, where y is the optimal threshold (see Problem 2(c)), and show that the error rate is approximately minimum at the optimal threshold. (d) Do parts (a) through (c) again for the case when Ho and H are equally probable. The only output necessary is the final plot of experimental bit error rate vs. etaList
Step by Step Solution
There are 3 Steps involved in it

Get step-by-step solutions from verified subject matter experts