

Question: 3 . Please use the data in Table 1 ONLY. Create a chart as per figure 1 below to determine if there are any trends
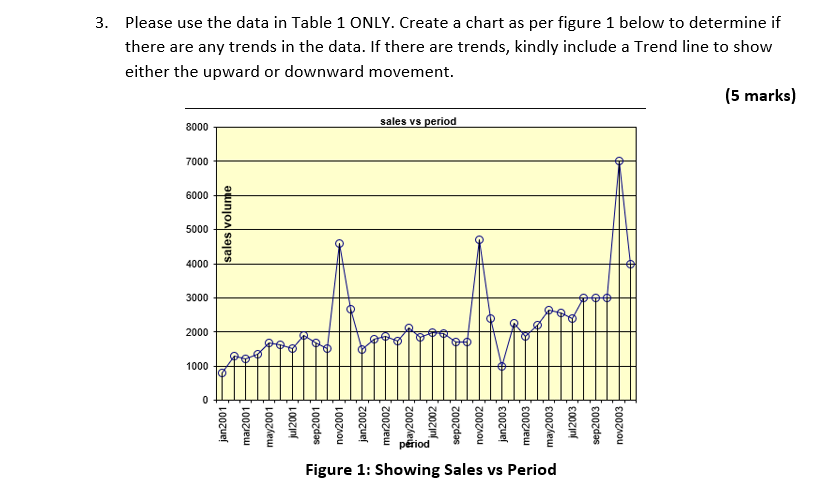
Please use the data in Table ONLY. Create a chart as per figure below to determine if there are any trends in the data. If there are trends, kindly include a Trend line to show either the upward or downward movement.
marks
Figure : Showing Sales vs Period
Table Showing customer demand per period below and attached
Please show how to make using excel
Step by Step Solution
There are 3 Steps involved in it
1 Expert Approved Answer
Step: 1 Unlock

Question Has Been Solved by an Expert!
Get step-by-step solutions from verified subject matter experts
Step: 2 Unlock
Step: 3 Unlock