

Question: 3 Plot a separate line chart for France, showing the value of the four components of GDP (on the vertical axis and time (the
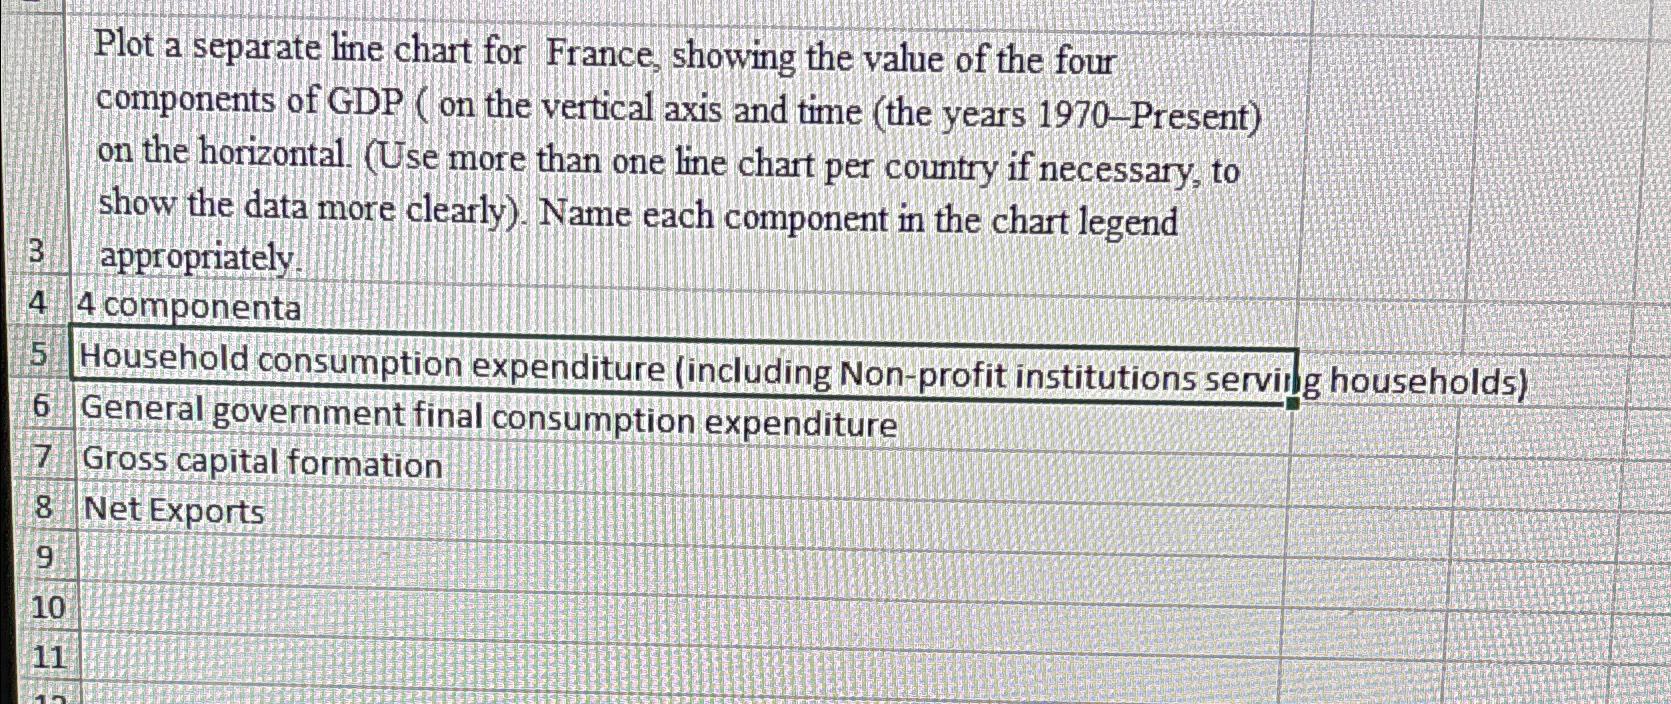
3 Plot a separate line chart for France, showing the value of the four components of GDP (on the vertical axis and time (the years 1970-Present) on the horizontal. (Use more than one line chart per country if necessary, to show the data more clearly). Name each component in the chart legend appropriately 4 4 componenta 5 Household consumption expenditure (including Non-profit institutions serving households) 6 General government final consumption expenditure 7 Gross capital formation 8 Net Exports 9 10 11
Step by Step Solution
There are 3 Steps involved in it
1 Expert Approved Answer
Step: 1 Unlock

Question Has Been Solved by an Expert!
Get step-by-step solutions from verified subject matter experts
Step: 2 Unlock
Step: 3 Unlock