

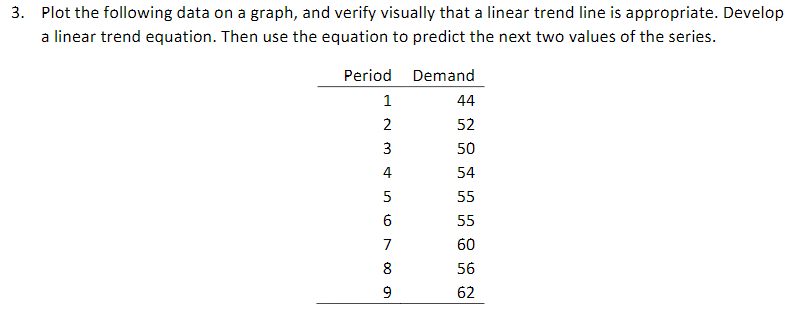
Question: 3. Plot the following data on a graph, and verify visually that a linear trend line is appropriate. Develop a linear trend equation. Then use
Step by Step Solution
There are 3 Steps involved in it
1 Expert Approved Answer
Step: 1 Unlock

Question Has Been Solved by an Expert!
Get step-by-step solutions from verified subject matter experts
Step: 2 Unlock
Step: 3 Unlock