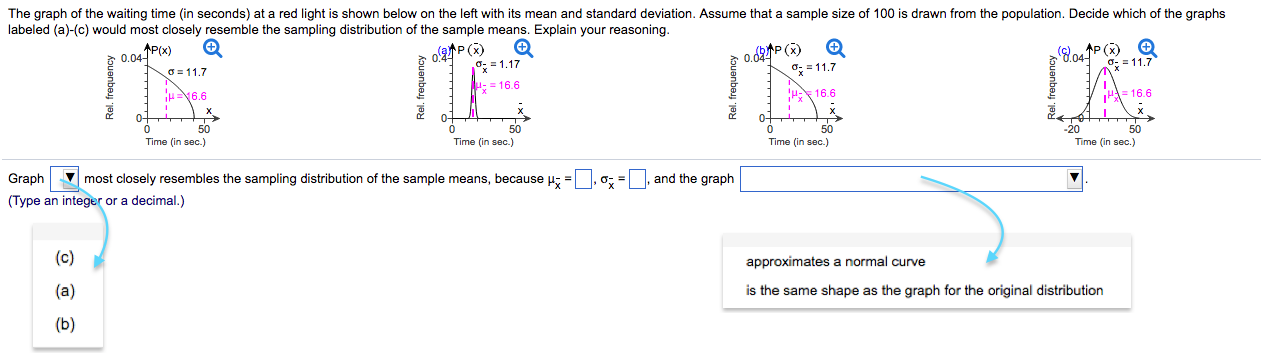
Question: 3 QUESTIONS ... PLEASE BE CLEAR WITH THE ANSWER. THANK YOU!! The graph of the waitlng time (in seconds) are red light is shown below

3 QUESTIONS ... PLEASE BE CLEAR WITH THE ANSWER. THANK YOU!!

3 QUESTIONS ... PLEASE BE CLEAR WITH THE ANSWER.3 QUESTIONS ... PLEASE BE CLEAR WITH THE ANSWER.3 QUESTIONS ... PLEASE BE CLEAR WITH THE ANSWER.
The graph of the waitlng time (in seconds) are red light is shown below on the left with its mean and standard deviation. Assume that a sample slze of 100 is drawn from the population Decide which oflhe graphs labeled (aHo} would most closely resemble the sampling distribution of lhe sample means. Explain your reasoning. A P so 61 a a a 5' u- =11 T E E E E 'm a 'm a a: n: a: n: 1 -2n 513 Time [In mm} mm [In as.) Time [m we.) nmann sec.) Graph most closely resembles the sampling distribution of the sample means, because u; = , a; = . and the graph : _ (Type en inte or a decimal.) (G) . appruxi'nales a normal write (a) is the same shape as the graph for ti-e original distribution (b) The population mean and standard deviation are given below. Find the required probability and determine whether the given sample mean would be considered unusual. For a sample of n =62, nd the probability of a sample mean being less than 23.5 if p = 24 and e = 1.21. a Click the icon to view page 1 01 the standard nonnal table. a Click the icon to view page 2 01 the standard nonnal table. For a sample of n =62, the probability dfa sample mean being less than 23.5 if p=24 and cr = 1.21 is (Round In four decimal places as needed.) mm! M Would the given sample mean be considered unusual mid 7/. m The sample mean a considered unusual beuuse it has a probability that is than 5%. \f

Step by Step Solution

There are 3 Steps involved in it

1 Expert Approved Answer
Step: 1 Unlock blur-text-image
Question Has Been Solved by an Expert!

Get step-by-step solutions from verified subject matter experts

Step: 2 Unlock
Step: 3 Unlock

Students Have Also Explored These Related Mathematics Questions!