

Question: 3. See the same Table 2.5 showing financial statement data and stock price data for Mydeco Corp. (3 points) a. How did Mydecos book debt-equity
3. See the same Table 2.5 showing financial statement data and stock price data for Mydeco Corp. (3 points)
a. How did Mydecos book debt-equity ratio change from 2012 to 2016?
b. How did Mydecos market debt-equity ratio change from 2012 to 2016?
c. Compute Mydecos debt-to-enterprise value ratio to assess how the fraction of its business that is debt financed has changed over the period.
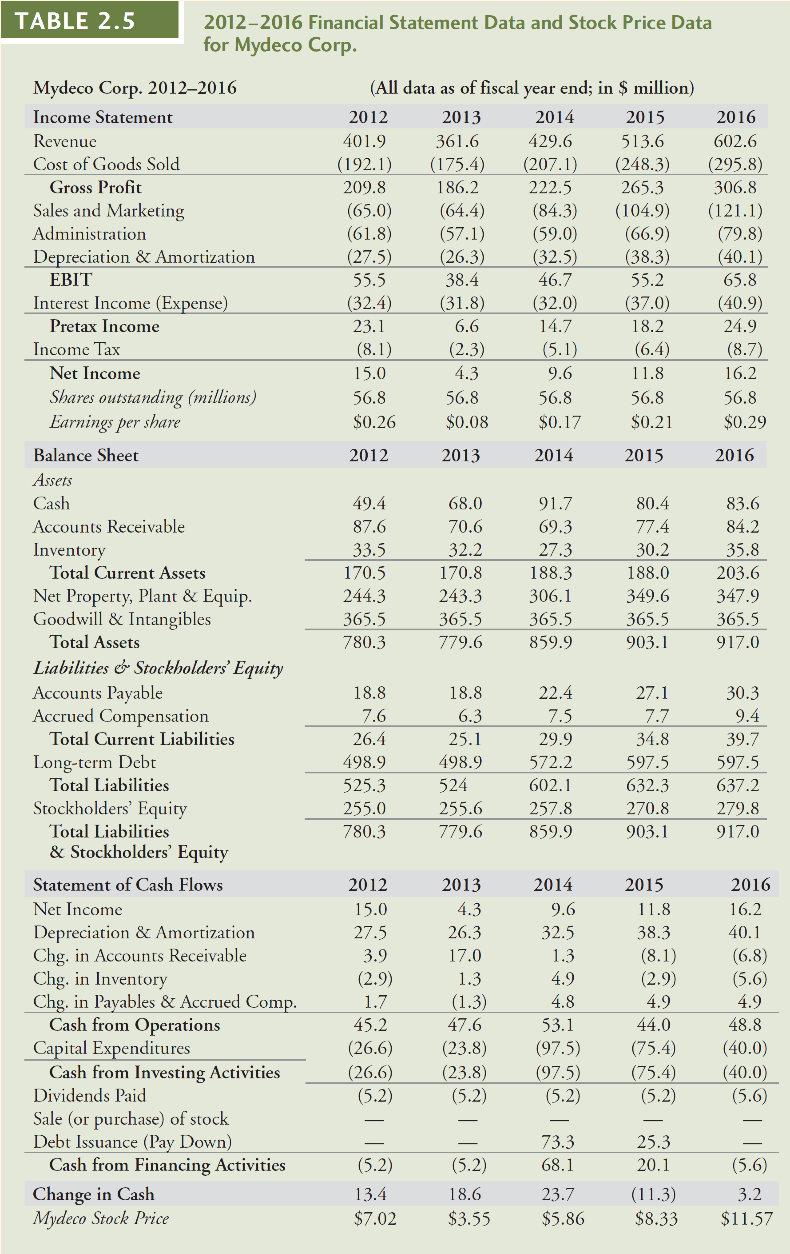
TABLE 2.5 2012-2016 Financial Statement Data and Stock Price Data for Mydeco Corp. (All data as of fiscal year end; in $ million) 2012 2013 2014 2015 401.9 361.6 429.6 513.6 (192.1) (175.4) (207.1) (248.3) 209.8 186.2 222.5 265.3 (65.0) (64.4) (84.3) (104.9) (61.8) (57.1) (59.0) (66.9) (27.5) (26.3) (32.5) (38.3) 55.5 38.4 46.7 55.2 (32.4) (31.8) (32.0) (37.0) 23.1 6.6 14.7 18.2 (8.1) (2.3) (5.1) (6.4) 15.0 4.3 9.6 11.8 56.8 56.8 56.8 56.8 $0.26 $0.08 $0.17 $0.21 2016 602.6 (295.8) 306.8 (121.1) (79.8) (40.1) 65.8 (40.9) 24.9 (8.7) 16.2 56.8 $0.29 2012 2013 2014 2015 2016 83.6 84.2 35.8 49.4 87.6 33.5 170.5 244.3 365.5 780.3 68.0 70.6 32.2 170.8 243.3 365.5 779.6 91.7 69.3 27.3 188.3 306.1 365.5 859.9 80.4 77.4 30.2 188.0 349.6 365.5 903.1 203.6 347.9 365.5 917.0 Mydeco Corp. 20122016 Income Statement Revenue Cost of Goods Sold Gross Profit Sales and Marketing Administration Depreciation & Amortization EBIT Interest Income (Expense) Pretax Income Income Tax Net Income Shares outstanding (millions) Earnings per share Balance Sheet Assets Cash Accounts Receivable Inventory Total Current Assets Net Property, Plant & Equip. Goodwill & Intangibles Total Assets Liabilities & Stockholders' Equity Accounts Payable Accrued Compensation Total Current Liabilities Long-term Debt Total Liabilities Stockholders' Equity Total Liabilities & Stockholders' Equity Statement of Cash Flows Net Income Depreciation & Amortization Chg. in Accounts Receivable Chg. in Inventory Chg. in Payables & Accrued Comp. Cash from Operations Capital Expenditures Cash from Investing Activities Dividends Paid Sale (or purchase) of stock Debt Issuance (Pay Down) Cash from Financing Activities Change in Cash Mydeco Stock Price 18.8 18.8 27.1 7.6 26.4 498.9 525.3 255.0 780.3 6.3 25.1 498.9 524 255.6 22.4 7.5 29.9 572.2 602.1 257.8 859.9 7.7 34.8 597.5 632.3 270.8 903.1 30.3 9.4 39.7 597.5 637.2 279.8 917.0 779.6 2012 15.0 27.5 3.9 (2.9) 1.7 45.2 (26.6) (26.6) (5.2) 2013 4.3 26.3 17.0 1.3 (1.3) 47.6 (23.8) (23.8) (5.2) 2014 9.6 32.5 1.3 4.9 4.8 53.1 (97.5) (97.5) (5.2) 2015 11.8 38.3 (8.1) (2.9) 4.9 44.0 (75.4) (75.4) (5.2) 2016 16.2 40.1 (6.8) (5.6) 4.9 48.8 (40.0) (40.0) (5.6) 73.3 68.1 25.3 20.1 (5.2) 13.4 $7.02 (5.2) 18.6 $3.55 23.7 $5.86 (11.3) $8.33 (5.6) 3.2 $11.57
Step by Step Solution
There are 3 Steps involved in it

Get step-by-step solutions from verified subject matter experts