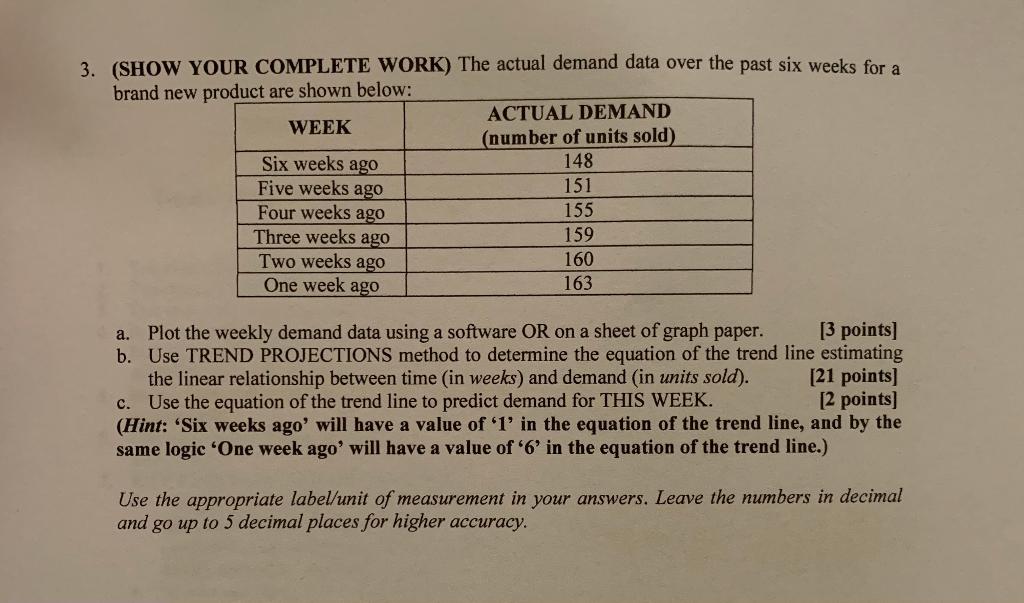
Question: 3. (SHOW YOUR COMPLETE WORK) The actual demand data over the past six weeks for a brand new product are shown below: ACTUAL DEMAND WEEK

3. (SHOW YOUR COMPLETE WORK) The actual demand

3. (SHOW YOUR COMPLETE WORK) The actual demand data over the past six weeks for a brand new product are shown below: ACTUAL DEMAND WEEK (number of units sold) Six weeks ago 148 Five weeks ago 151 Four weeks ago 155 Three weeks ago 159 Two weeks ago 160 One week ago 163 a. Plot the weekly demand data using a software OR on a sheet of graph paper. [3 points] b. Use TREND PROJECTIONS method to determine the equation of the trend line estimating the linear relationship between time in weeks) and demand (in units sold). [21 points) c. Use the equation of the trend line to predict demand for THIS WEEK. [2 points) (Hint: 'Six weeks ago' will have a value of '1' in the equation of the trend line, and by the same logic "One week ago' will have a value of '6' in the equation of the trend line.) Use the appropriate label/unit of measurement in your answers. Leave the numbers in decimal and go up to 5 decimal places for higher accuracy

Step by Step Solution

There are 3 Steps involved in it

1 Expert Approved Answer
Step: 1 Unlock blur-text-image
Question Has Been Solved by an Expert!

Get step-by-step solutions from verified subject matter experts

Step: 2 Unlock
Step: 3 Unlock

Students Have Also Explored These Related General Management Questions!