Question: complete on paper and show all work, anything else is unwanted. round to 5 decimal places 3. (SHOW YOUR COMPLETE WORK) The actual demand data

complete on paper and show all work, anything else is unwanted. round to 5 decimal places complete on paper and show all work, anything
3. (SHOW YOUR COMPLETE WORK) The actual demand data over the past eight months for a brand new product are shown below: MONTH ACTUAL DEMAND (number of units sold) February 2020 656 March 2020 600 April 2020 560 May 2020 524 June 2020 492 July 2020 472 August 2020 470 September 2020 466 a. Plot the monthly demand data using a software OR on a sheet of graph paper. [3 points) b. Use TREND PROJECTIONS method to determine the equation of the trend line estimating the linear relationship between time (in months) and demand (in units sold). [25 points) c. Use the equation of the trend line to predict demand for the month of October 2020. [2 points) (Hint: February 2020' will have a value of 'l' in the equation of the trend line, and by the same logic "September 2020' will have a value of '8' in the equation of the trend line.)

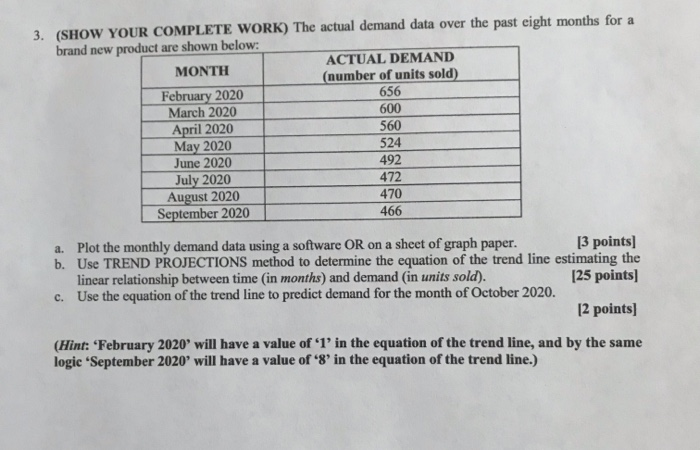
Step by Step Solution

There are 3 Steps involved in it

1 Expert Approved Answer
Step: 1 Unlock blur-text-image
Question Has Been Solved by an Expert!

Get step-by-step solutions from verified subject matter experts

Step: 2 Unlock
Step: 3 Unlock

Students Have Also Explored These Related General Management Questions!