

Question: 3. Single Index Model for asset returns has the form Rit where = i = t = = i + RMt + Eit, Eit
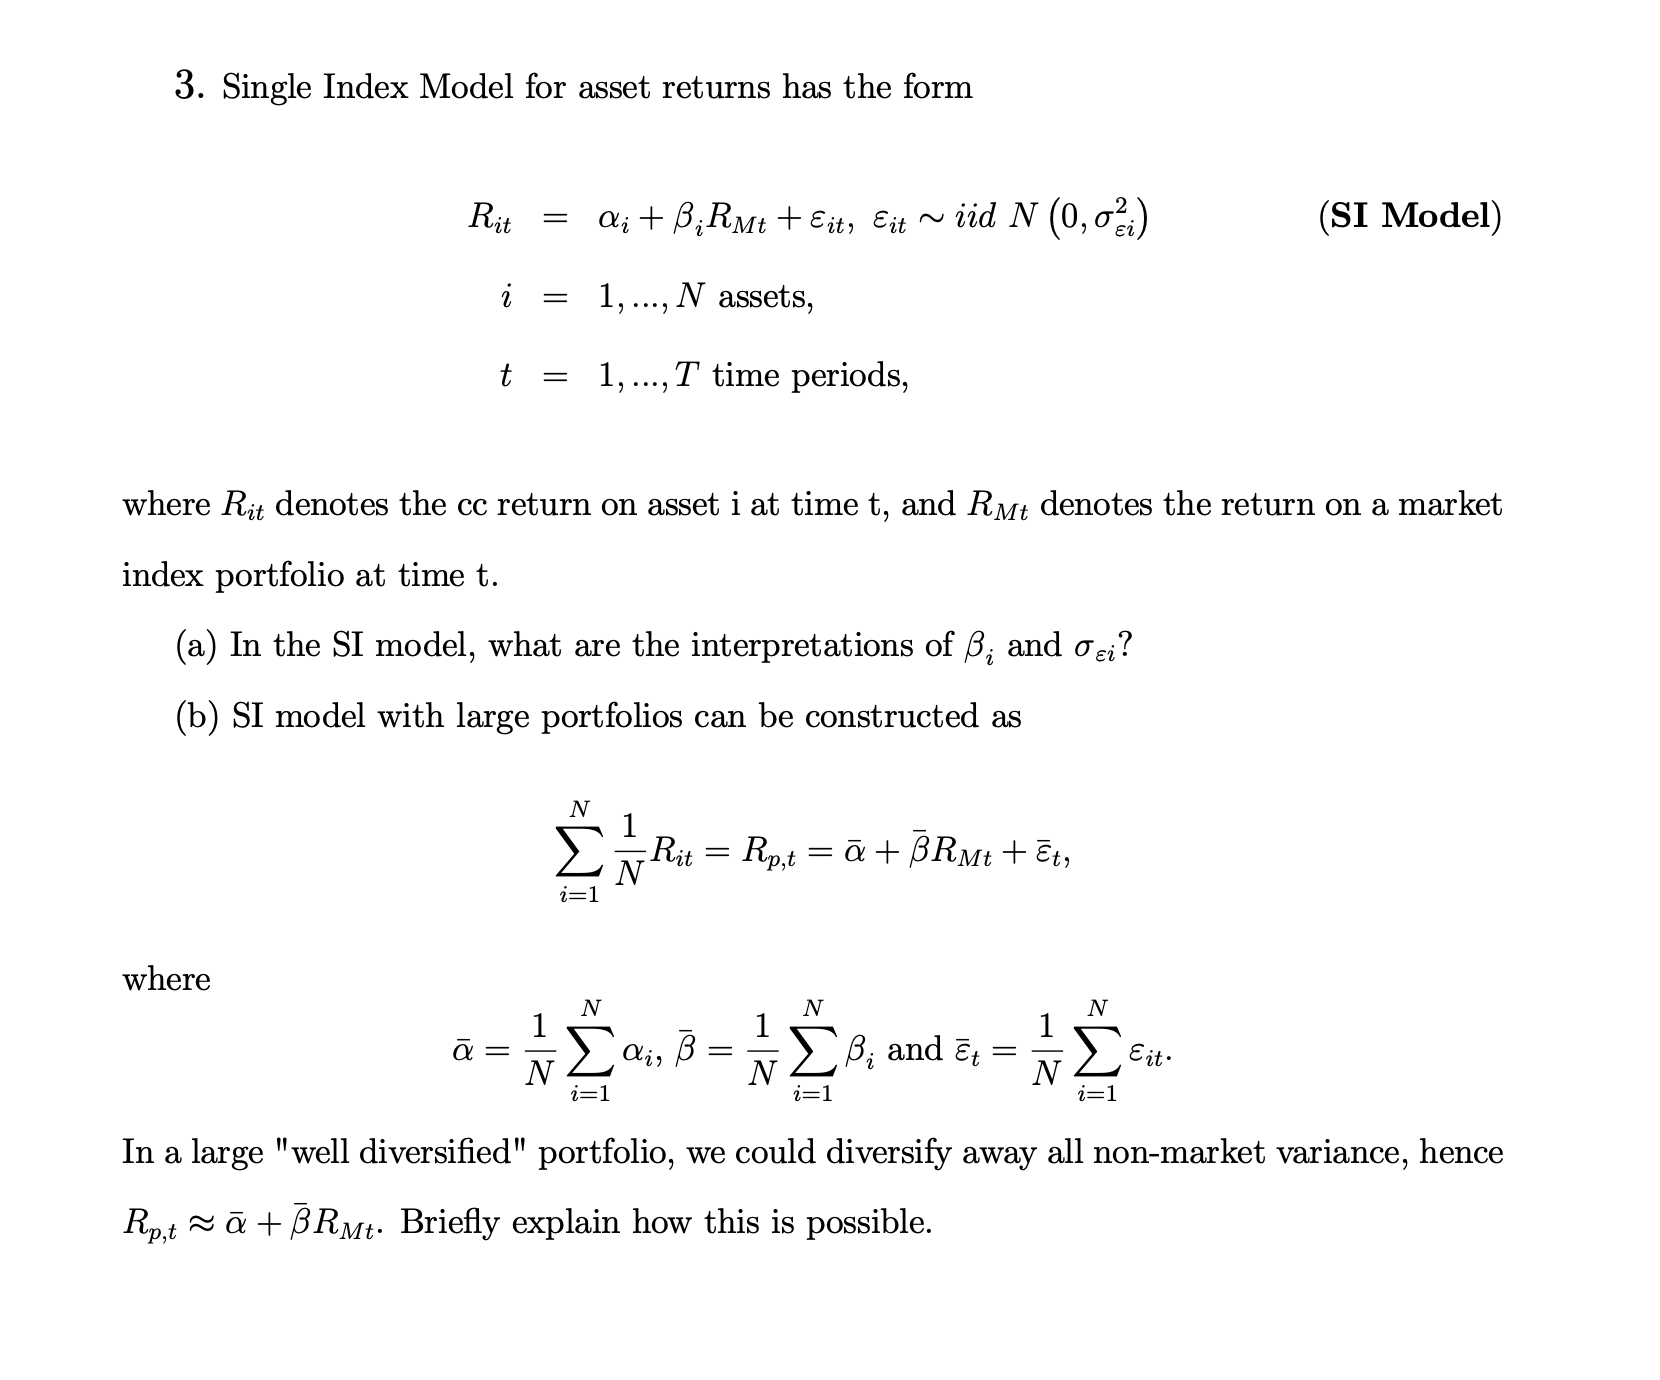
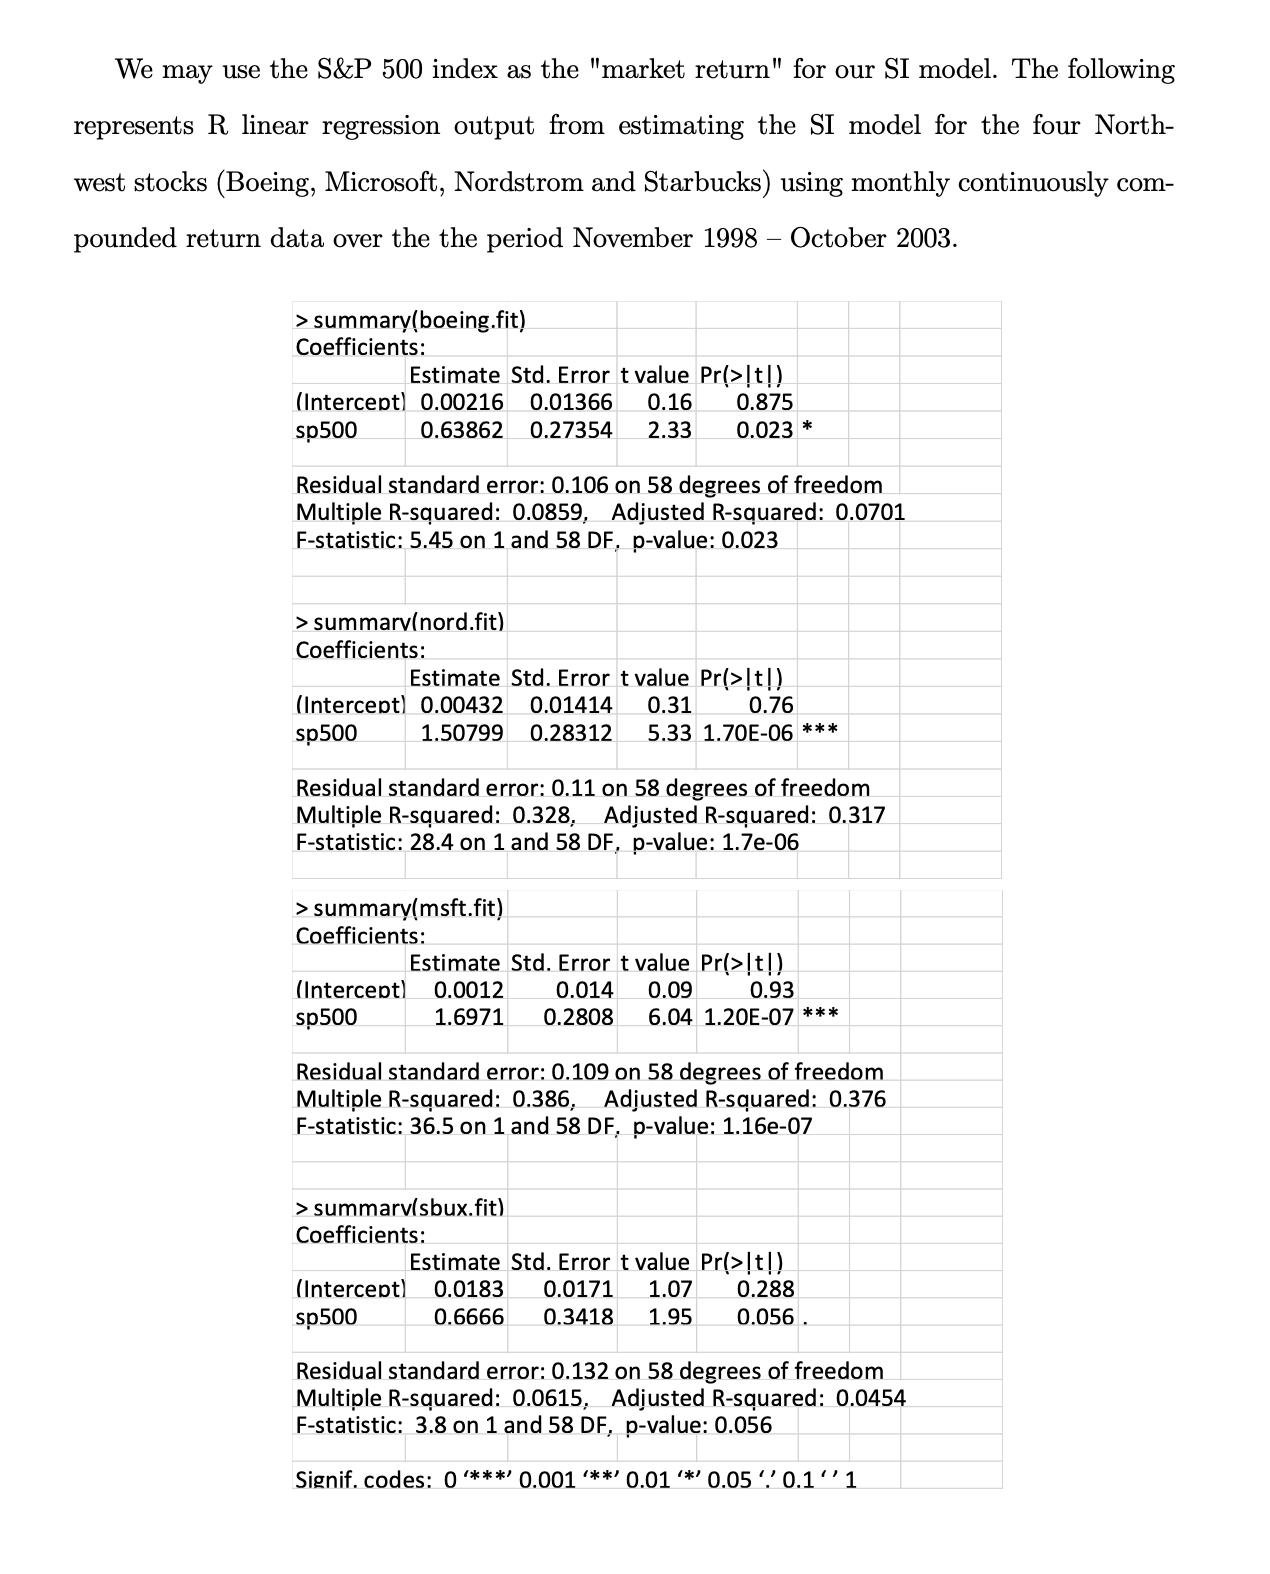
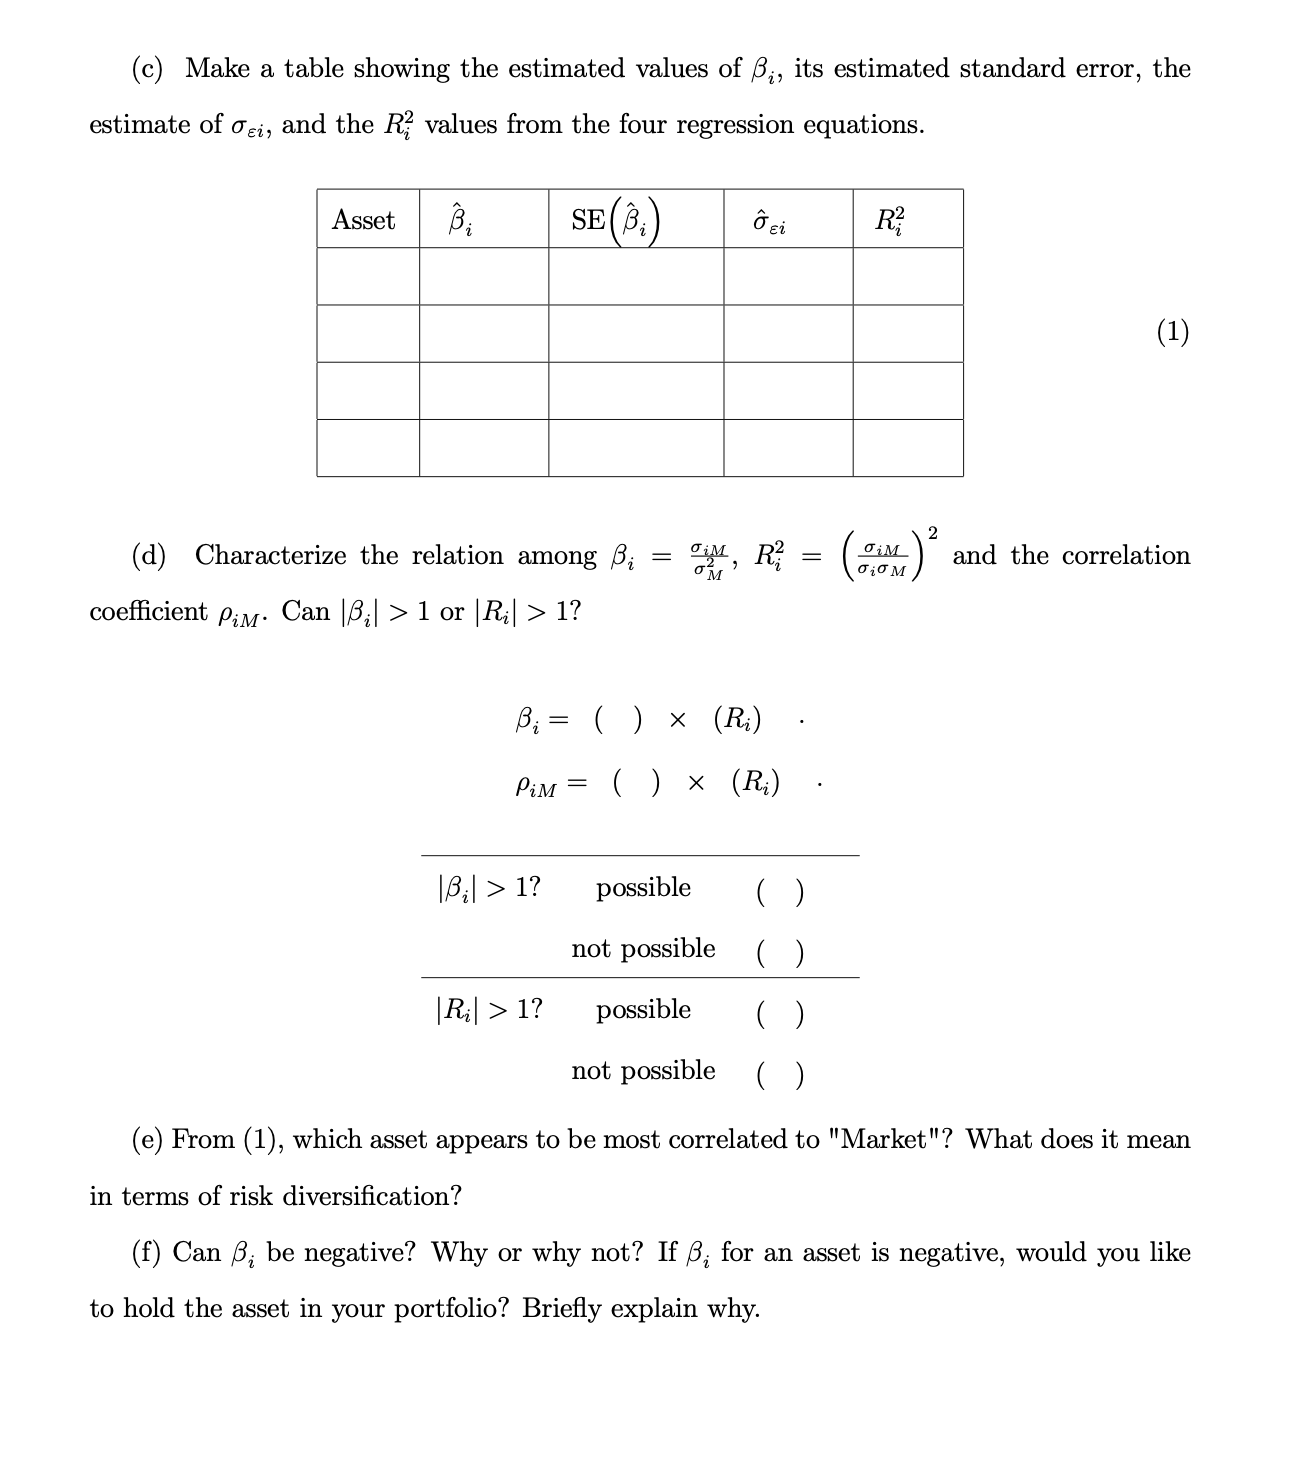
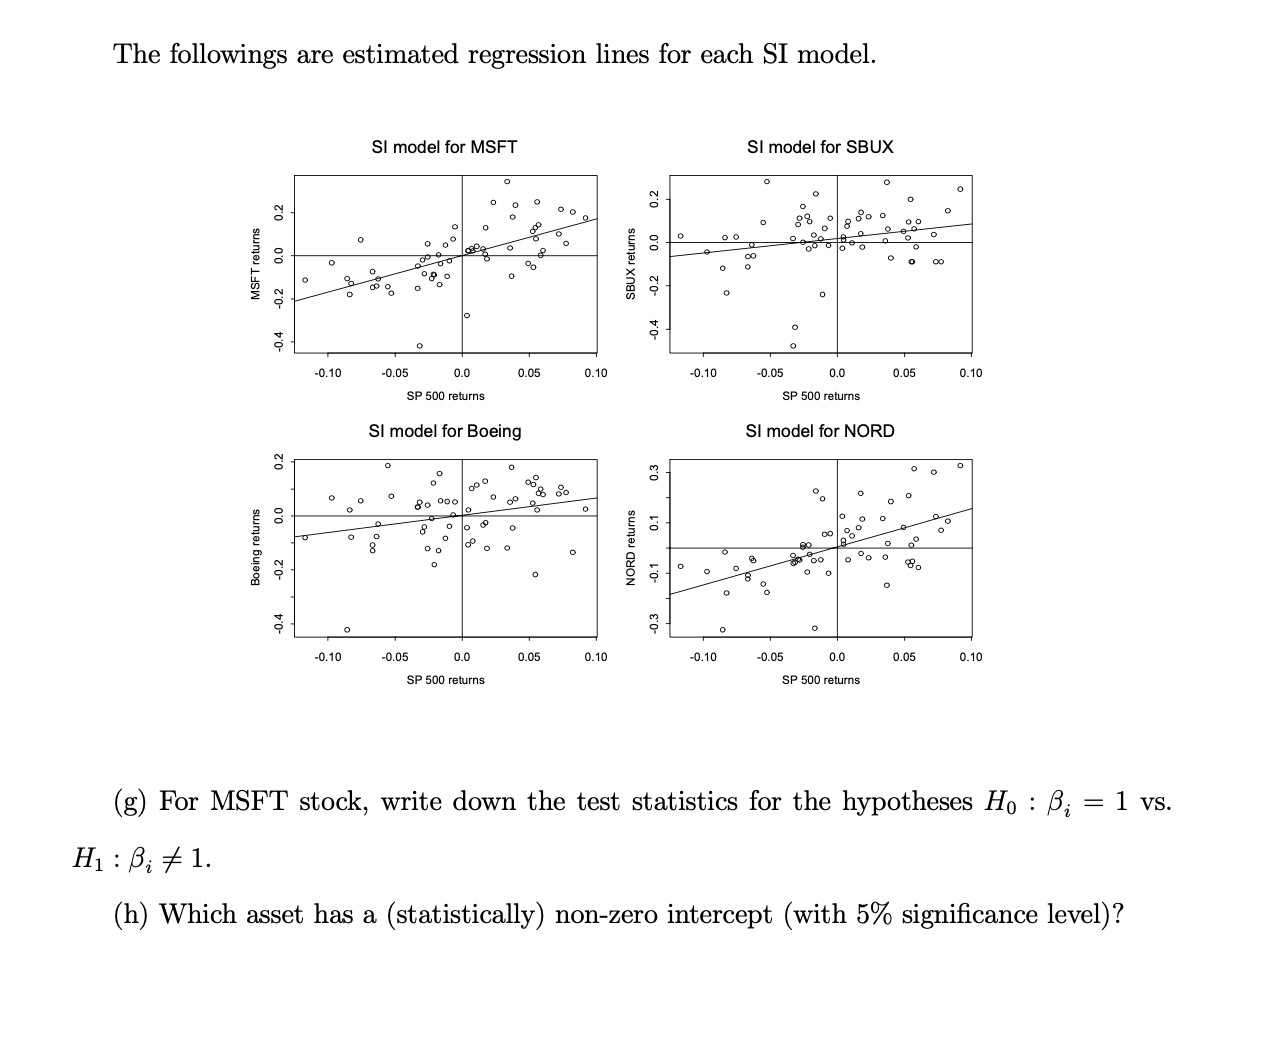
3. Single Index Model for asset returns has the form Rit where = i = t = = i + RMt + Eit, Eit ~ iid N (0,0) where Rit denotes the cc return on asset i at time t, and RMt denotes the return on a market index portfolio at time t. (a) In the SI model, what are the interpretations of ; and ei? (b) SI model with large portfolios can be constructed as N 1, ..., N assets, 1,..., T time periods, i=1 N - Rit i=1 N air = B Rp,t = + BRMt+t, In a large "well diversified" portfolio, we could diversify away all non-market variance, hence Rp.t +RMt. Briefly explain how this is possible. N i=1 B, and Et = N N (SI Model) i=1 E it. We may use the S&P 500 index as the "market return" for our SI model. The following represents R linear regression output from estimating the SI model for the four North- west stocks (Boeing, Microsoft, Nordstrom and Starbucks) using monthly continuously com- pounded return data over the the period November 1998 - October 2003. > summary(boeing.fit) Coefficients: Estimate Std. Error t value Pr(> [t]) (Intercept) 0.00216 0.01366 0.16 0.875 sp500 0.63862 0.27354 2.33 0.023 * Residual standard error: 0.106 on 58 degrees of freedom Multiple R-squared: 0.0859, Adjusted R-squared: 0.0701 F-statistic: 5.45 on 1 and 58 DF, p-value: 0.023 > summarv(nord.fit) Coefficients: Estimate Std. Error t value Pr(>[t!) (Intercept) 0.00432 0.01414 0.31 0.76 sp500 1.50799 0.28312 5.33 1.70E-06 *** Residual standard error: 0.11 on 58 degrees of freedom Multiple R-squared: 0.328, Adjusted R-squared: 0.317 F-statistic: 28.4 on 1 and 58 DF, p-value: 1.7e-06 > summary(msft.fit) Coefficients: Estimate Std. Error t value Pr(>[t!) (Intercept) 0.0012 sp500 0.014 0.09 0.93 1.6971 0.2808 6.04 1.20E-07 *** Residual standard error: 0.109 on 58 degrees of freedom Multiple R-squared: 0.386, Adjusted R-squared: 0.376 F-statistic: 36.5 on 1 and 58 DF, p-value: 1.16e-07 > summarv(sbux.fit) Coefficients: Estimate Std. Error t value Pr(>[t!) (Intercept) 0.0183 0.0171 1.07 0.288 sp500 0.6666 0.3418 1.95 0.056. Residual standard error: 0.132 on 58 degrees of freedom Multiple R-squared: 0.0615, Adjusted R-squared: 0.0454 F-statistic: 3.8 on 1 and 58 DF, p-value: 0.056 Signif. codes: 0 ***' 0.001 '**' 0.01 '*' 0.05 0.11 (c) Make a table showing the estimated values of ;, its estimated standard error, the estimate of oi, and the R values from the four regression equations. SE (3.) Asset 3. = (d) Characterize the relation among coefficient PM. Can |;| > 1 or | Ri| > 1? |B| B = ( ) (Ri) ci PiM ( ) (R) > 1? = |R| > 1? OM, R = (cm) R/ possible not possible possible not possible ( ) (e) From (1), which asset appears to be most correlated to "Market"? What does it mean in terms of risk diversification? ( ) (1) and the correlation (f) Can , be negative? Why or why not? If , for an asset is negative, would to hold the asset in your portfolio? Briefly explain why. you like The followings are estimated regression lines for each SI model. MSFT returns 0.2 -0.2 0.0 -0.4 0.2 0.0 Boeing returns -0.2 O -0.10 O -0.10 8 O O O o SI model for MSFT o 0 O 8 -0.05 O O o O -0.05 08 0 8 o 0 0.0 SP 500 returns SI model for Boeing 0 O 80 00 O O 28 0 00 0 8 9 0.0 SP 500 returns O O O o 0 0 0 O O S % 0.05 O % % 0.05 O 0.10 O 0.10 0.2 SBUX returns -0.2 0.0 0.4 0.3 0.1 NORD returns -0.1 8 0 O -0.10 O -0.10 00 O 0 O O SI model for SBUX O 00 O O -0.05 8 0 o O O -0.05 o O 0.0 SP 500 returns O SI model for NORD 00 0 O 8 00 O O 0 0.0 SP 500 returns O O O o O O 0 o 0.05 0 0 0.05 O O 00 O O 0.10 0.10 (g) For MSFT stock, write down the test statistics for the hypotheses Ho : ; = 1 vs. H : B; # 1. (h) Which asset has a (statistically) non-zero intercept (with 5% significance level)?
Step by Step Solution
There are 3 Steps involved in it
a In the SI model represents the sensitivity or the coefficient of asset i with respect to the market index portfolio return RMt It measures the assets systematic risk or market risk A higher value of ... View full answer

Get step-by-step solutions from verified subject matter experts