

Question: a. Pareto chart. 3. During the past month, a customer-satisfaction survey was given to 200 customers at a local fast-food restaurant. The following complaints
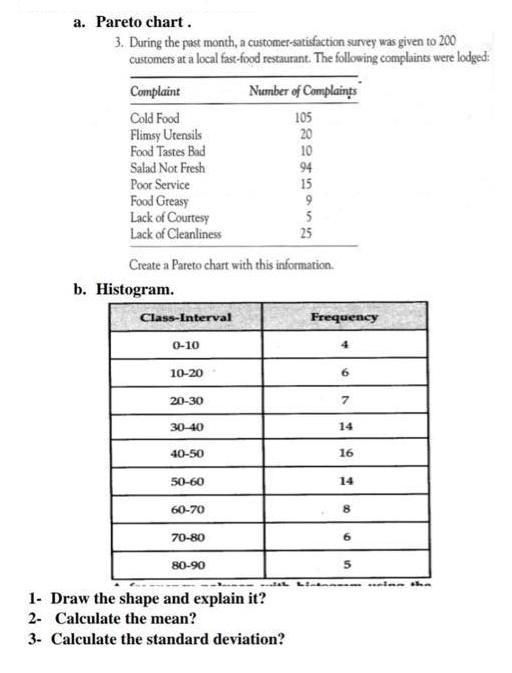
a. Pareto chart. 3. During the past month, a customer-satisfaction survey was given to 200 customers at a local fast-food restaurant. The following complaints were lodged: Complaint Number of Complaints Cold Food Flimsy Utensils Food Tastes Bad Salad Not Fresh 105 20 10 94 15 Poor Service Food Greasy Lack of Courtesy Lack of Cleanliness 5 25 Create a Pareto chart with this information. b. Histogram. Class-Interval Frequency 0-10 4. 10-20 20-30 7. 30-40 14 40-50 16 50-60 14 60-70 70-80 6. 80-90 1- Draw the shape and explain it? 2- Calculate the mean? 3- Calculate the standard deviation?
Step by Step Solution
3.40 Rating (162 Votes )
There are 3 Steps involved in it
Solition 2 ducenting Avotange Cold Jood Salad Not fesh Lack of hanliness data in ding o... View full answer

Get step-by-step solutions from verified subject matter experts