

Question: 3. Study the dot plot below. it I I '1 w. w. 4:. Determine whether each of the following would be an appropriate label based
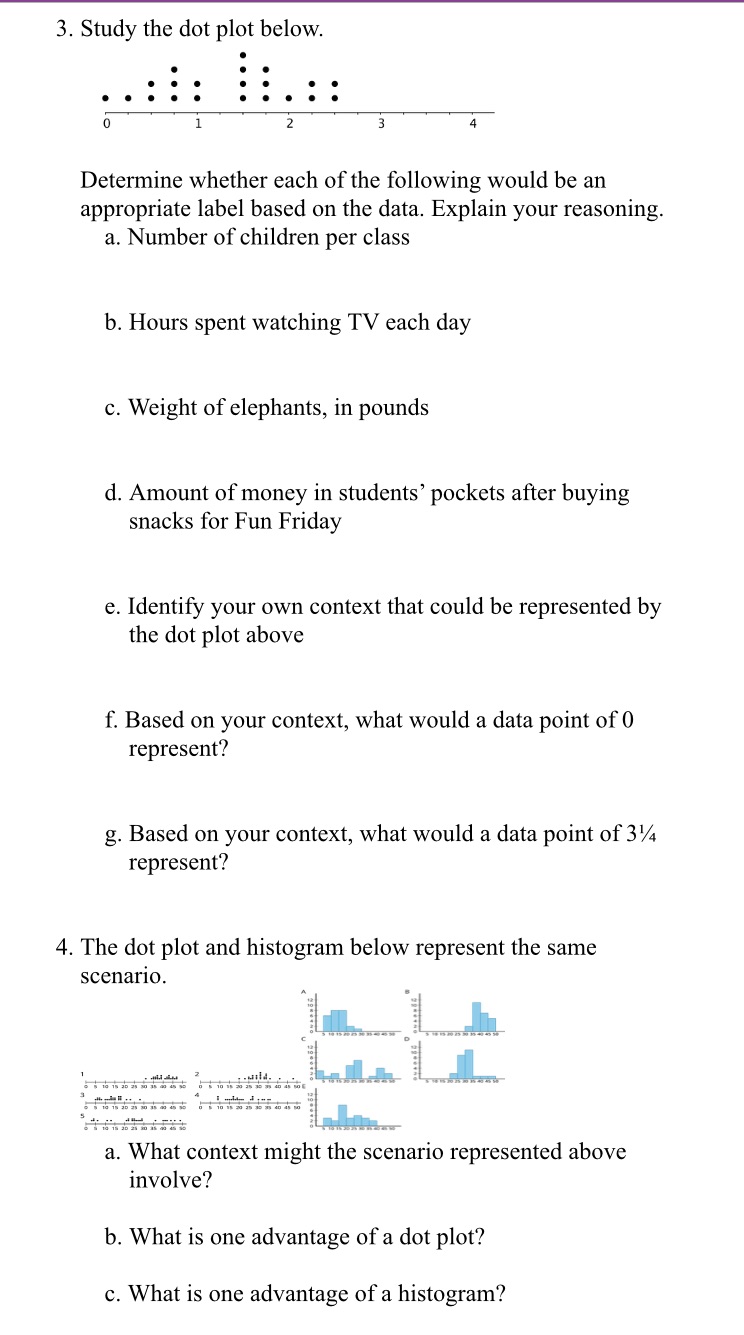
3. Study the dot plot below. it I I '1 w. w. 4:. Determine whether each of the following would be an appropriate label based on the data. Explain your reasoning. a. Number of children per class b. Hours spent watching TV each day c. Weight of elephants, in pounds (1. Amount of money in students\" pockets after buying snacks for Fun Friday e. Identify your own context that could be represented by the dot plot above f. Based on your context, what would a data point of 0 represent? g. Based on your context, what would a data point of 3% represent? 4. The dot plot and histogram below represent the same scenario . .. 2.2! and ._... I I J' -\\..unu4-.-\\-_ a. What context might the scenario represented above involve? b. What is one advantage ofa dot plot? c. What is one advantage of a histogram
Step by Step Solution
There are 3 Steps involved in it

Get step-by-step solutions from verified subject matter experts