

Question: 3) Suppose that a baseball player has the ABILITY to get a hit in 30% of his at-bats. The following dotplots show the results of
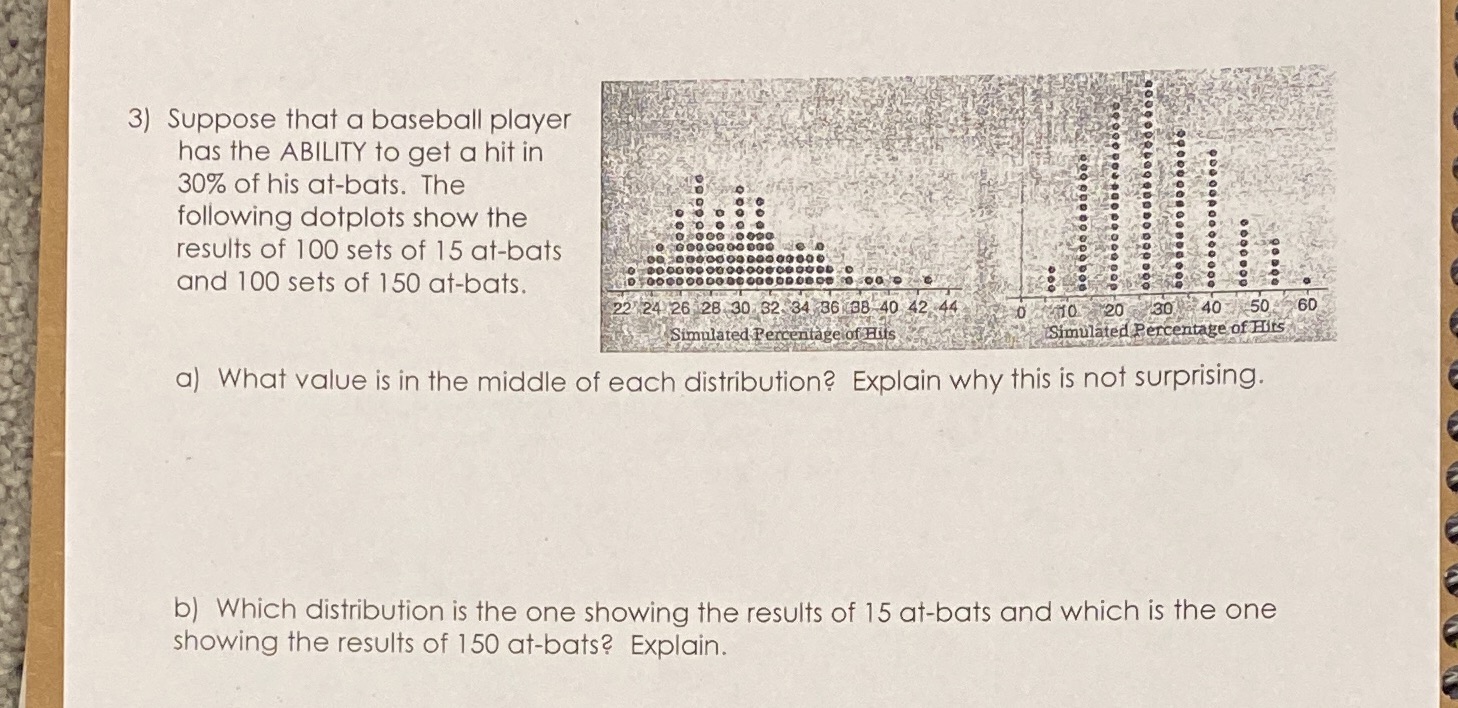
3) Suppose that a baseball player has the ABILITY to get a hit in 30% of his at-bats. The following dotplots show the results of 100 sets of 15 at-bats 20 0080800 086 09000 and 100 sets of 150 at-bats. 22 24 26 28 30 32, 34 36 38 40 42 4 10 20 30 40 50 60 Simulated Percentage of Hits Simulated Percentage of Hits a) What value is in the middle of each distribution? Explain why this is not surprising. b) Which distribution is the one showing the results of 15 at-bats and which is the one showing the results of 150 at-bats? Explain
Step by Step Solution
There are 3 Steps involved in it
1 Expert Approved Answer
Step: 1 Unlock

Question Has Been Solved by an Expert!
Get step-by-step solutions from verified subject matter experts
Step: 2 Unlock
Step: 3 Unlock