

Question: 3. Table and Chart Development (20 pts.) a) Draw a stacked bar graph showing the number of students doing their first and second internships in
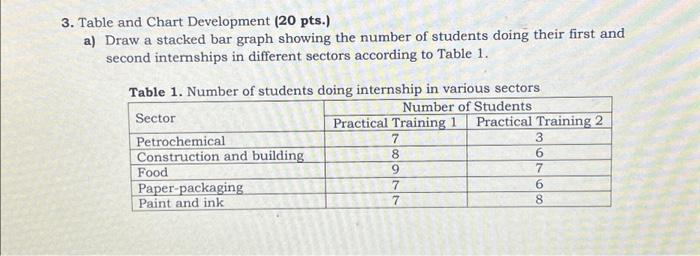
3. Table and Chart Development (20 pts.) a) Draw a stacked bar graph showing the number of students doing their first and second internships in different sectors according to Table 1. Table 1. Number of students doing internship in various sectors Number of Students doing internship in various rector.
3. Table and Chart Development (20 pts.) a) Draw a stacked bar graph showing the number of students doing their first and second internships in different sectors according to Table 1. Table 1. Number of students doing internship in various sectors 3. Table and Chart Development (20 pts.) a) Draw a stacked bar graph showing the number of students doing their first and second internships in different sectors according to Table 1. Table 1. Number of students doing internship in various sectors
Step by Step Solution
There are 3 Steps involved in it
1 Expert Approved Answer
Step: 1 Unlock

Question Has Been Solved by an Expert!
Get step-by-step solutions from verified subject matter experts
Step: 2 Unlock
Step: 3 Unlock