

Question: Table and Chart Development a ) Draw a stacked bar graph showing the number of students doing their first and second internships in different sectors
Table and Chart Development
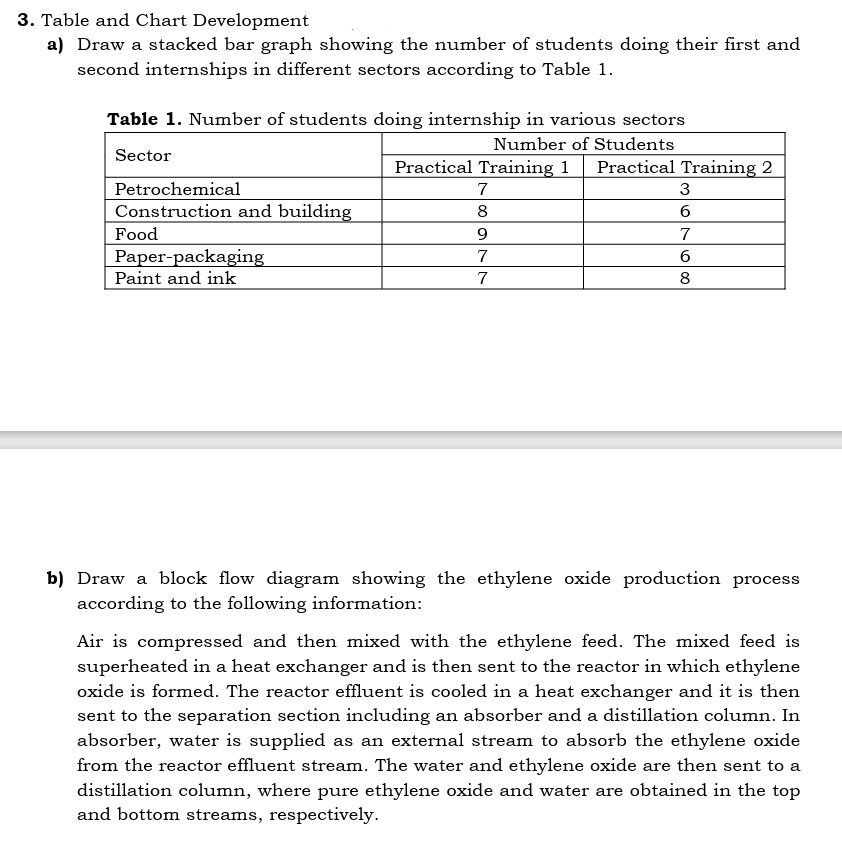
a Draw a stacked bar graph showing the number of students doing their first and
second internships in different sectors according to Table
Table Number of students doing internship in various sectors
b Draw a block flow diagram showing the ethylene oxide production process
according to the following information:
Air is compressed and then mixed with the ethylene feed. The mixed feed is
superheated in a heat exchanger and is then sent to the reactor in which ethylene
oxide is formed. The reactor effluent is cooled in a heat exchanger and it is then
sent to the separation section including an absorber and a distillation column. In
absorber water is supplied as an external stream to absorb the ethylene oxide
from the reactor effluent stream. The water and ethylene oxide are then sent to a
distillation column, where pure ethylene oxide and water are obtained in the top
and bottom streams, respectively.
Step by Step Solution
There are 3 Steps involved in it
1 Expert Approved Answer
Step: 1 Unlock

Question Has Been Solved by an Expert!
Get step-by-step solutions from verified subject matter experts
Step: 2 Unlock
Step: 3 Unlock