

Question: 3. The coefficient of determination and the sample correlation coefficient Aa Aa Nambe manufactures a line of metal tableware called Nambeware. A piece of Nambeware
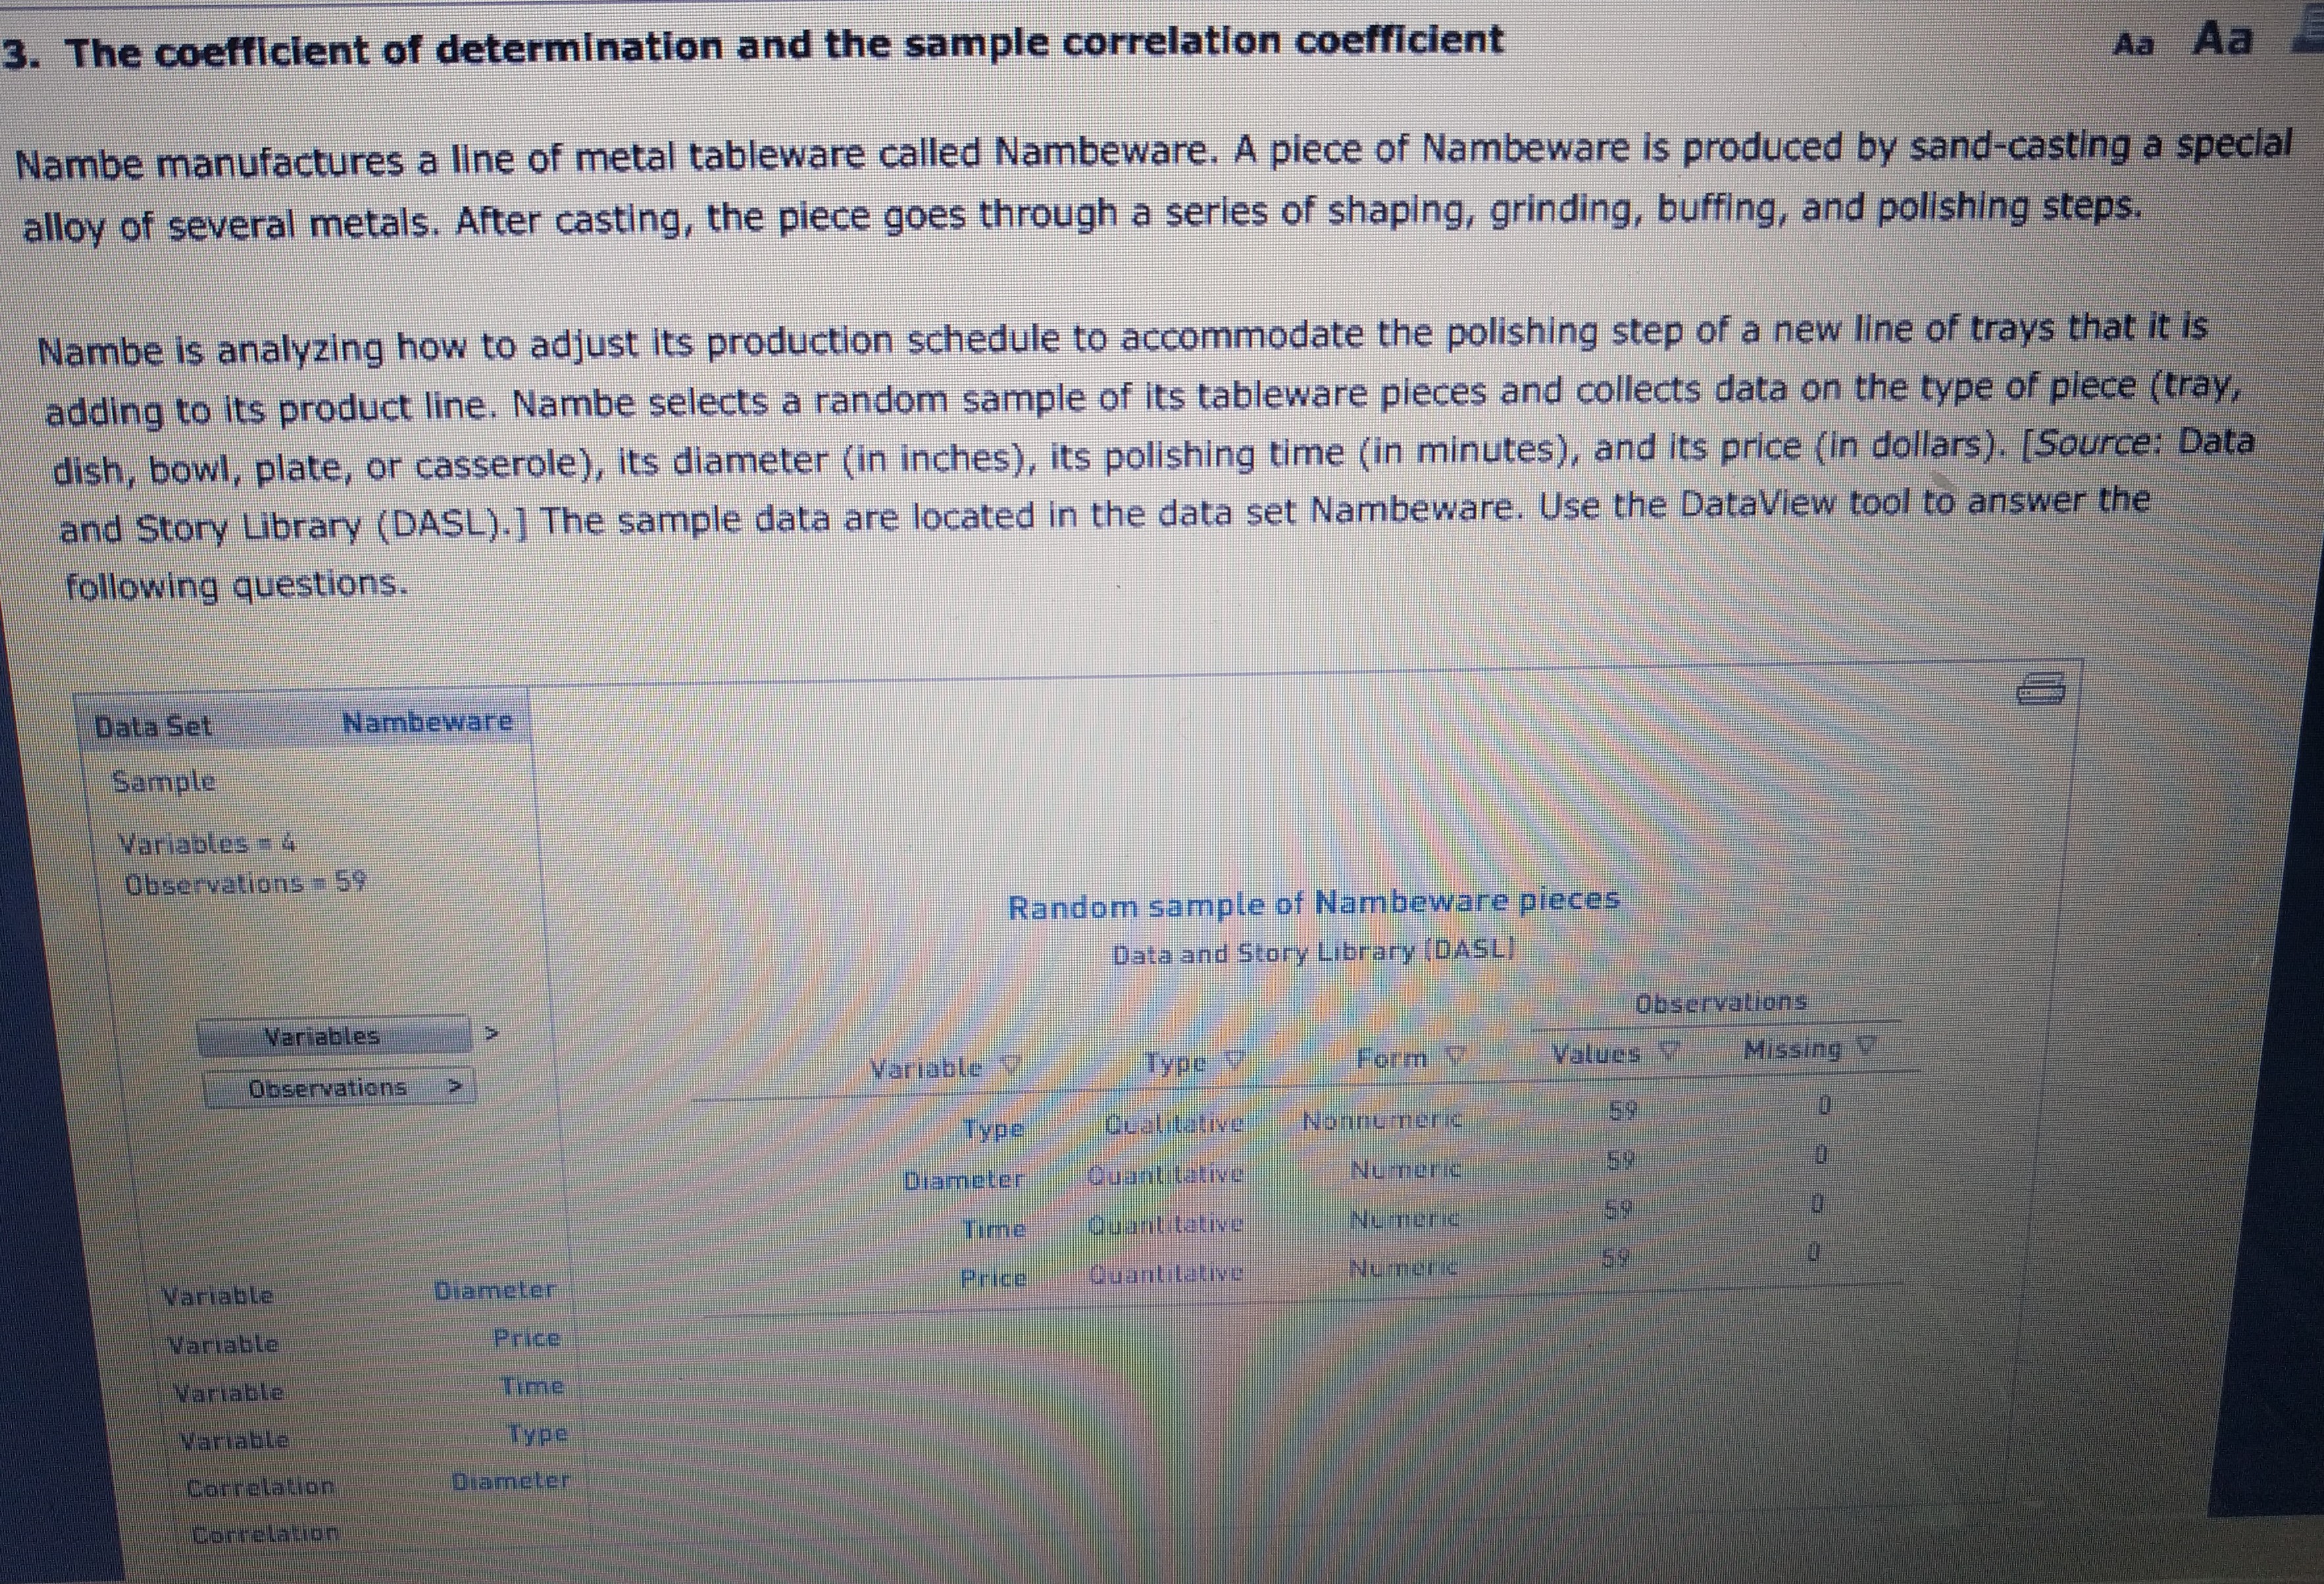
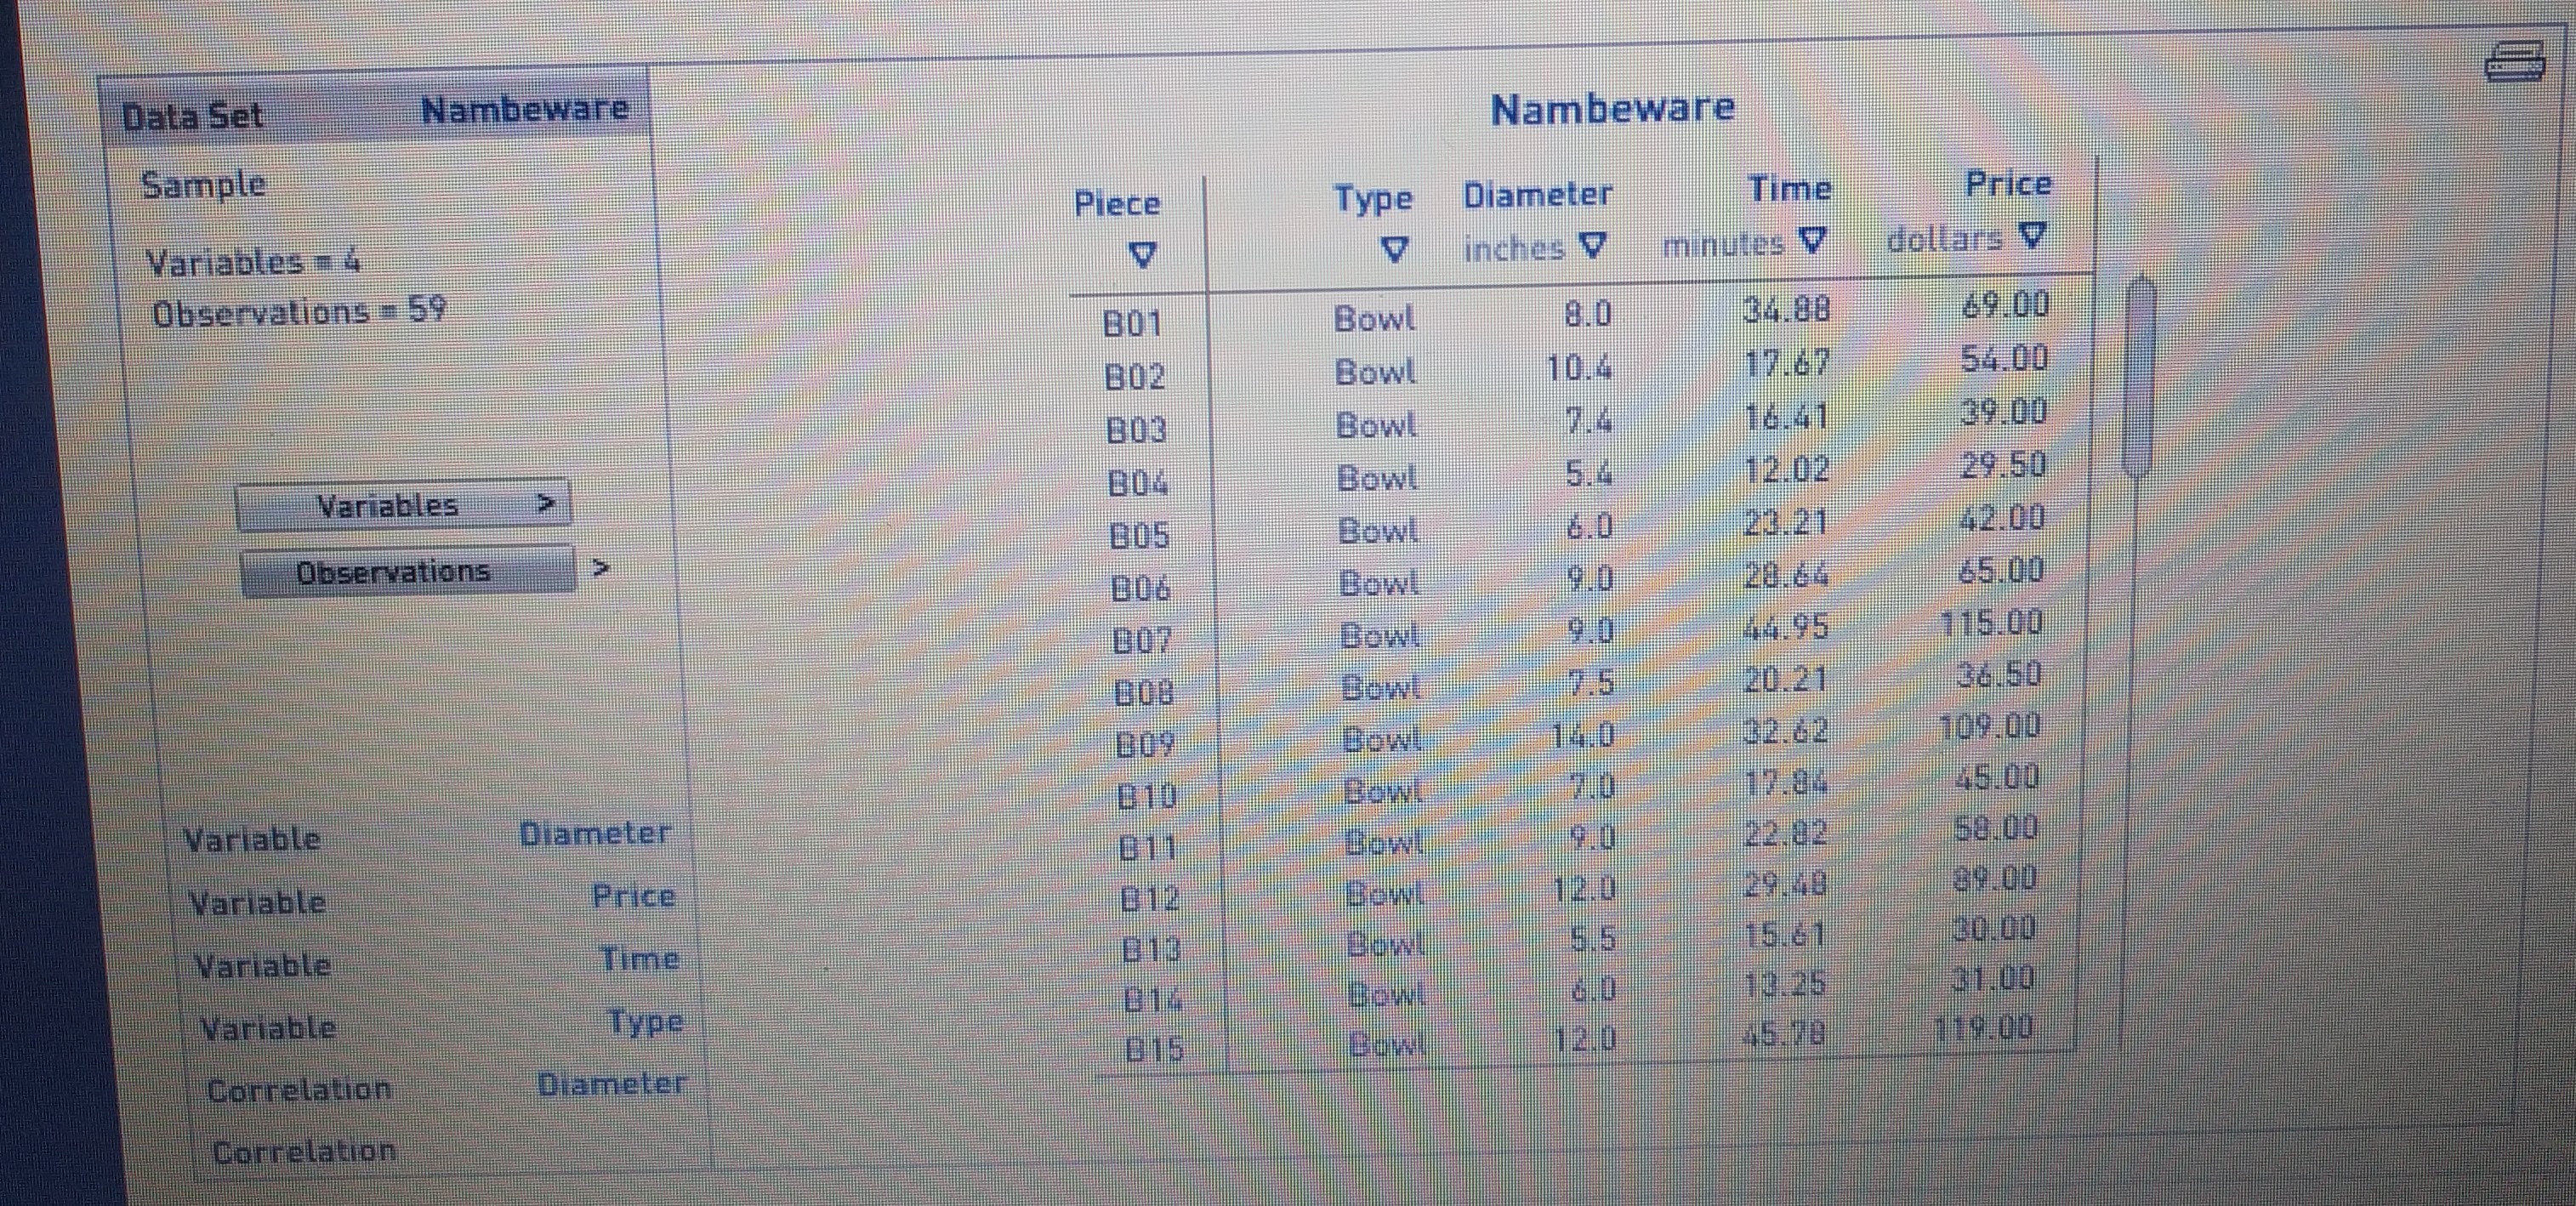
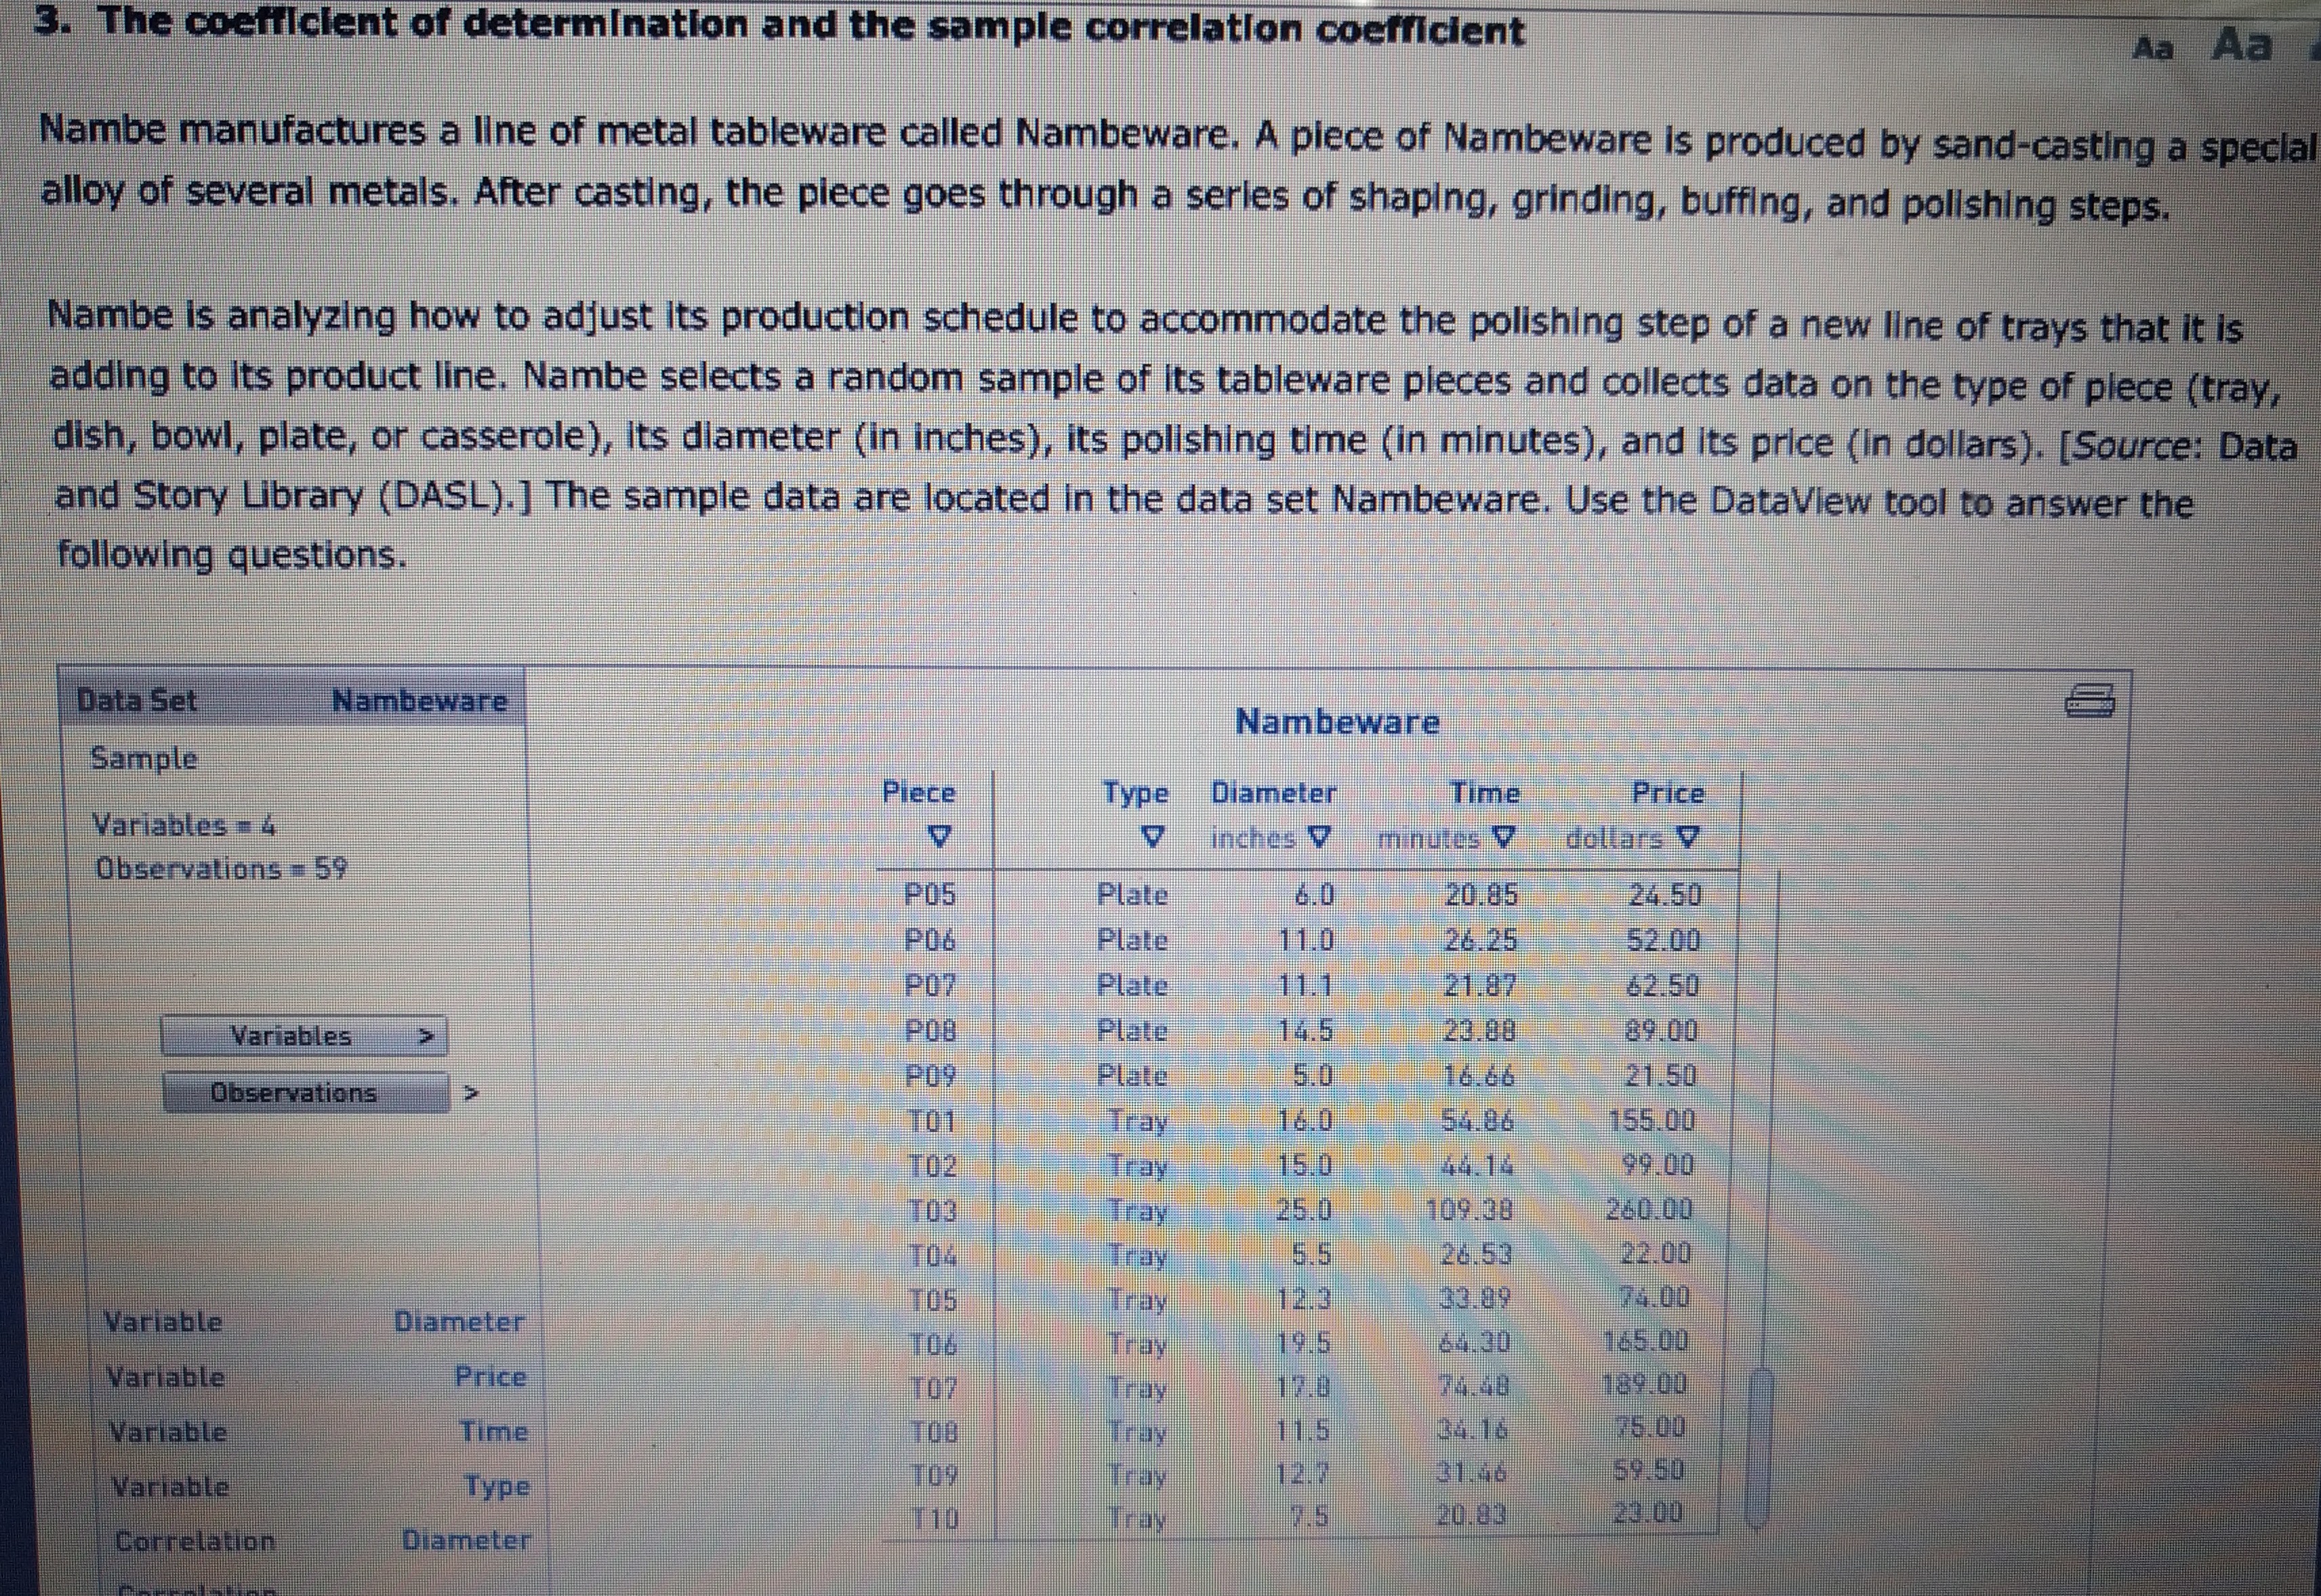
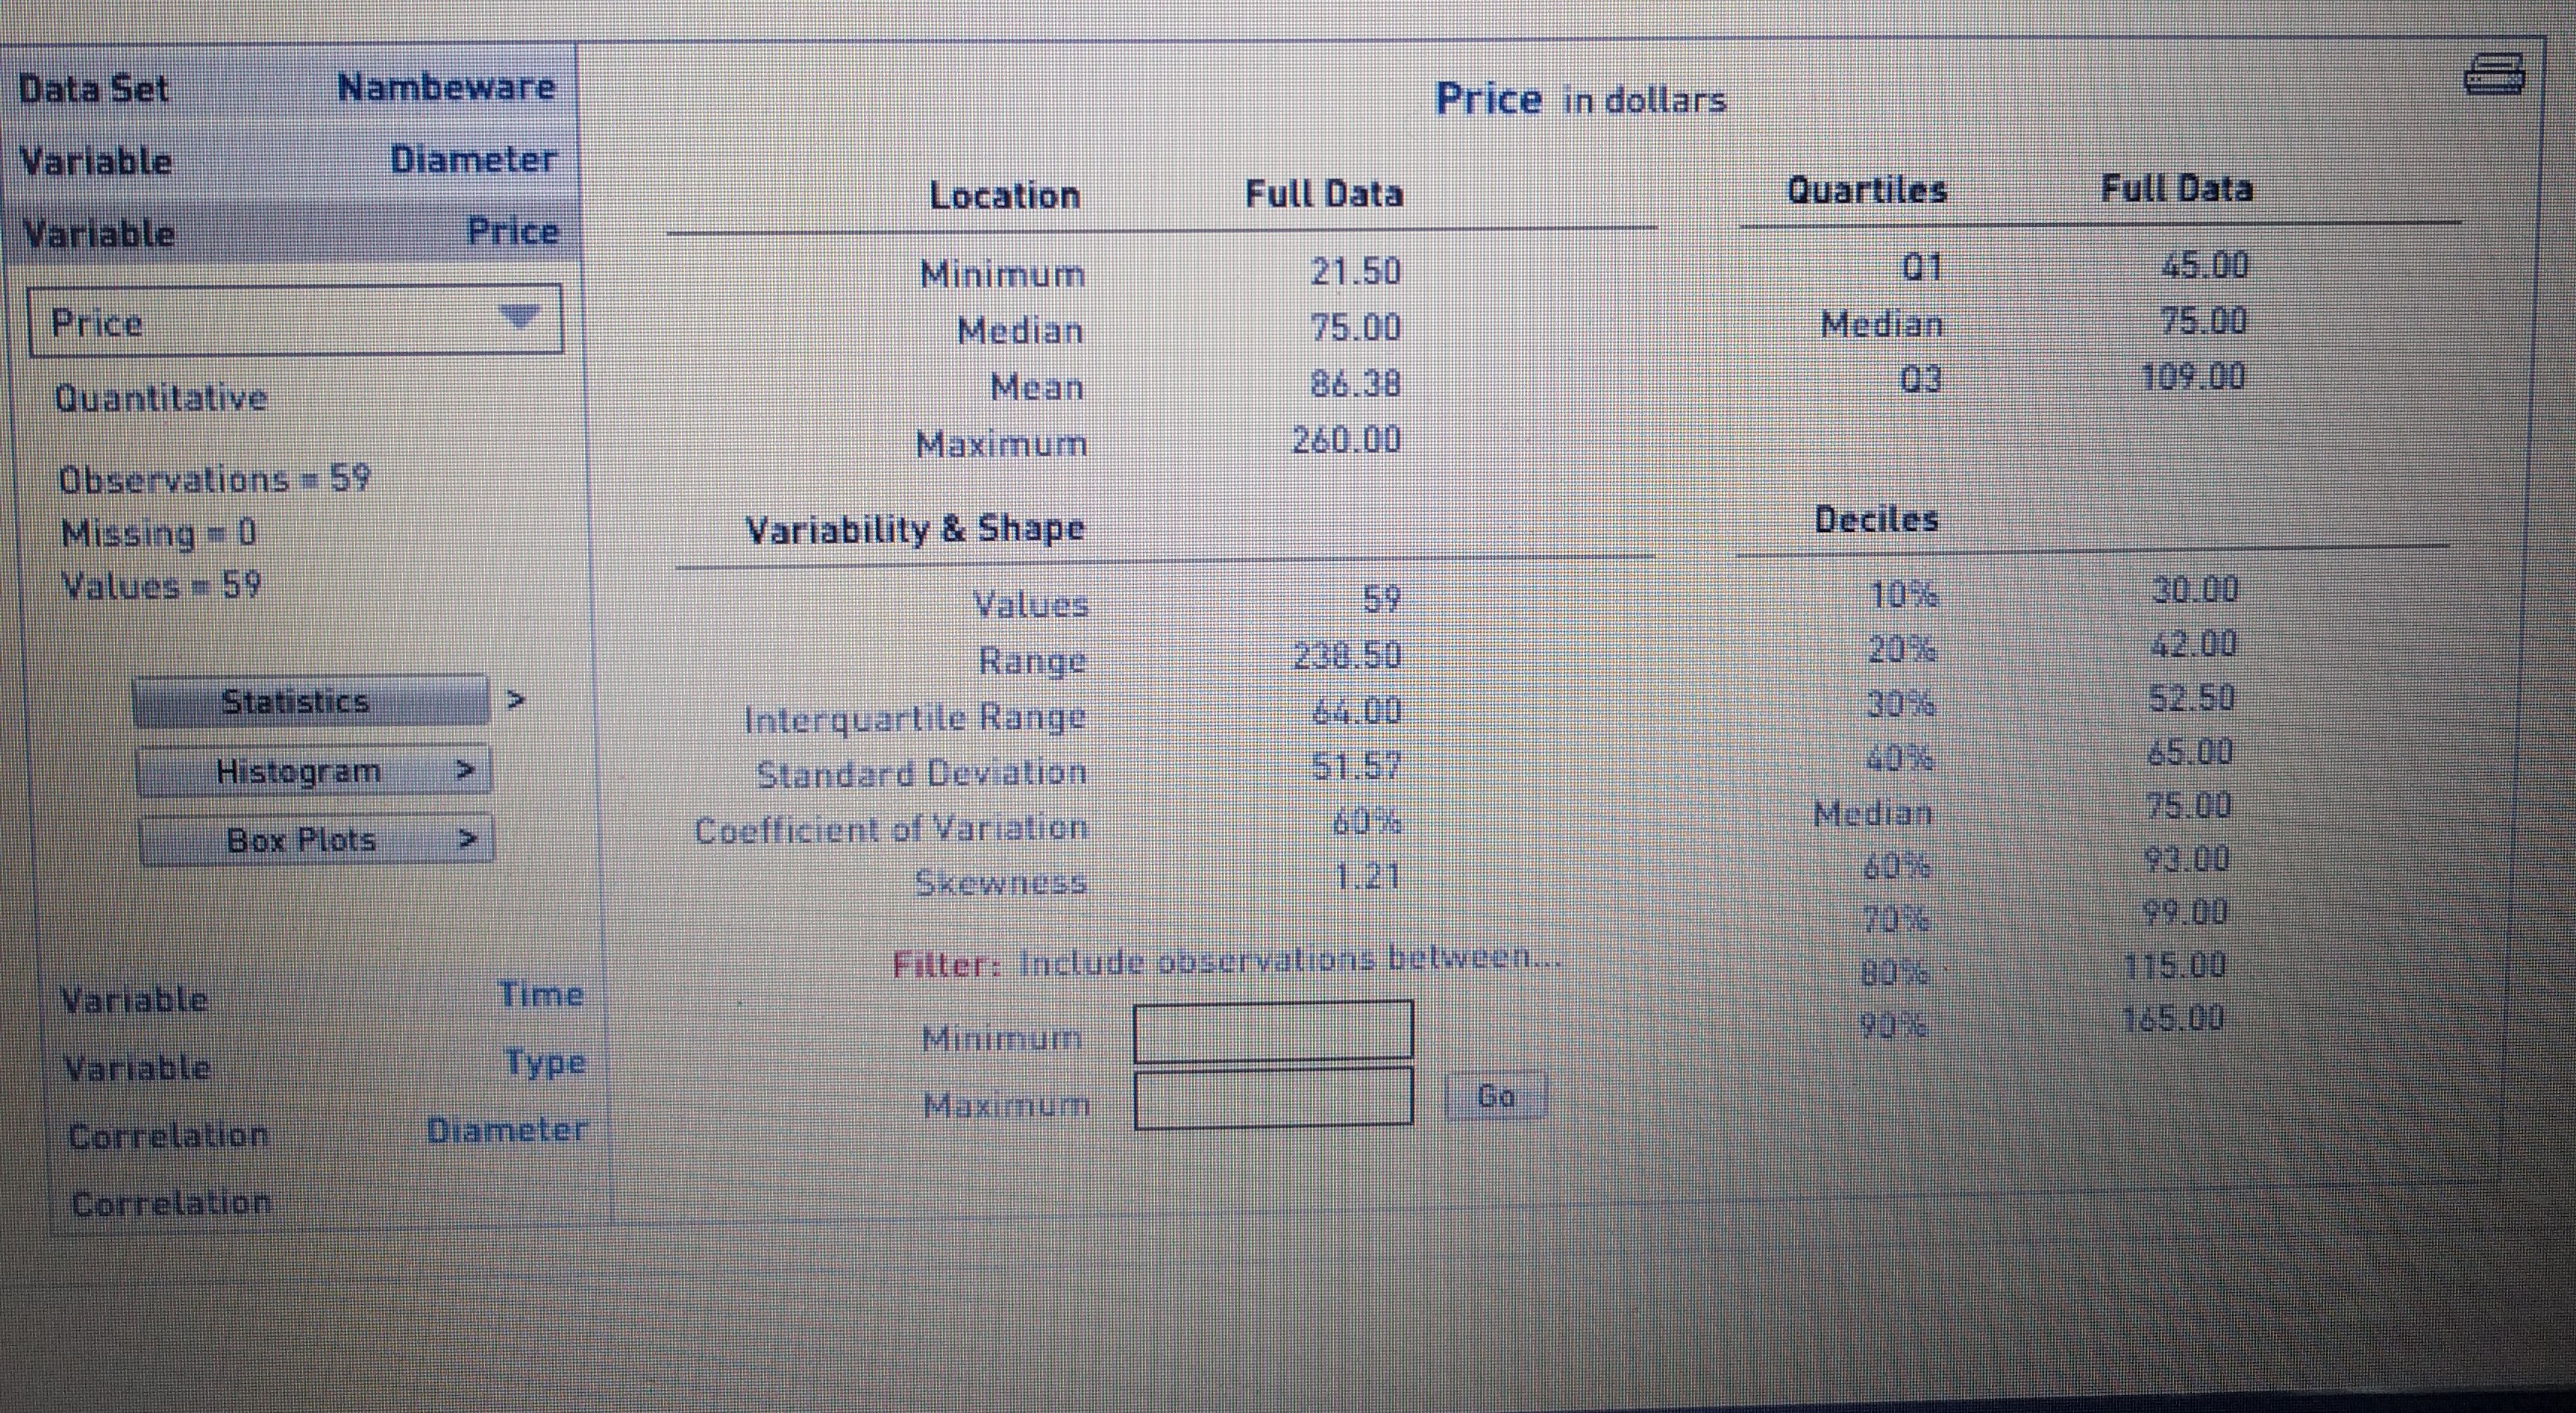
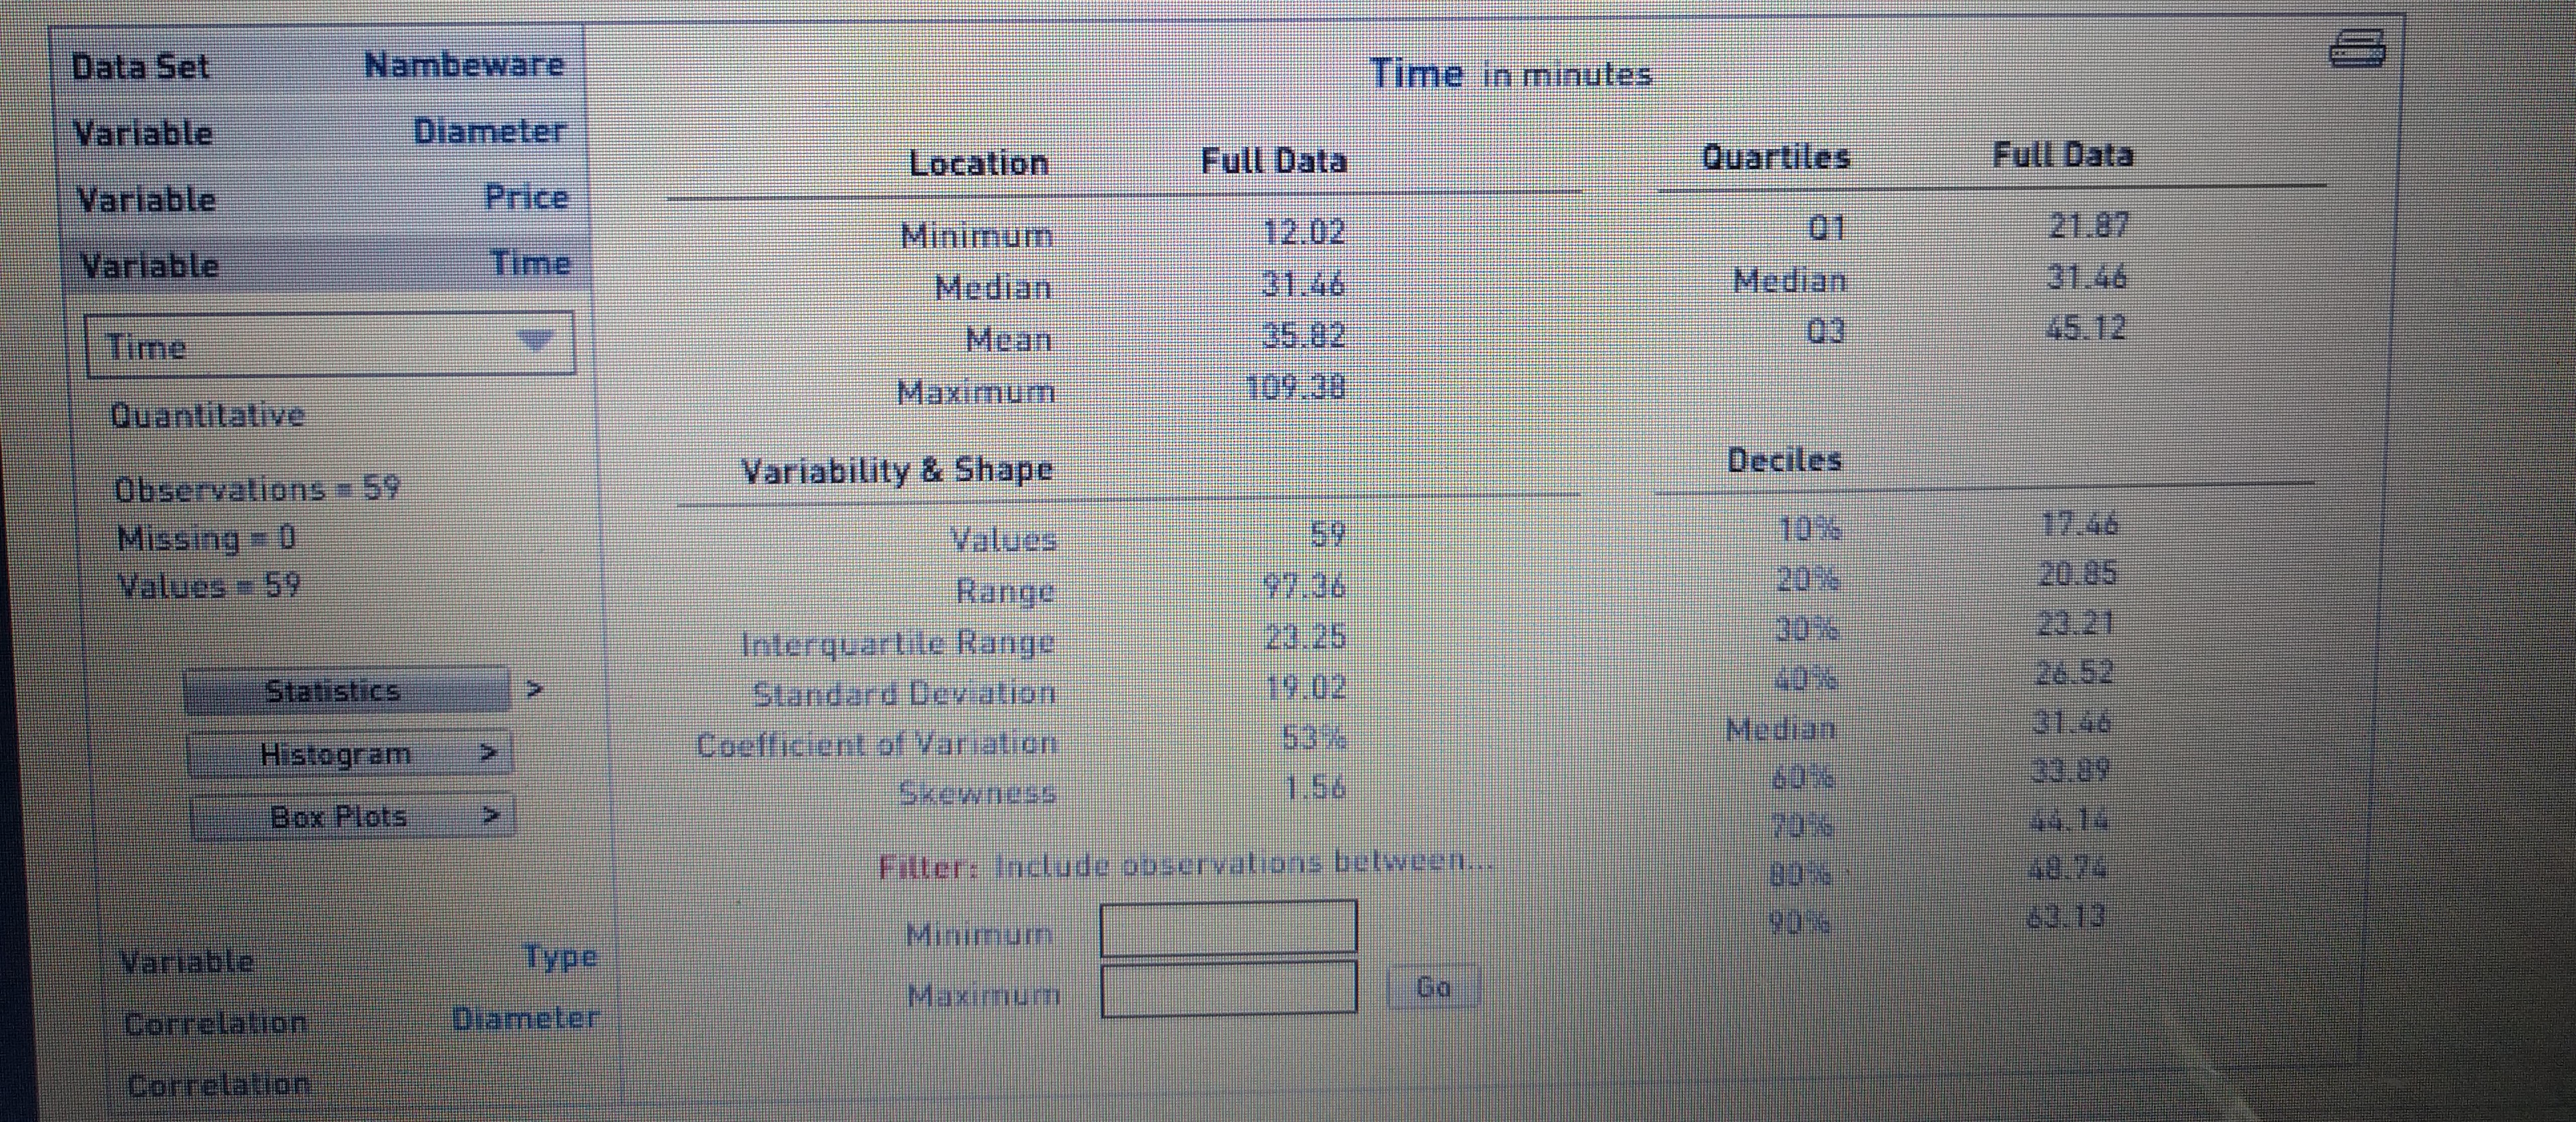
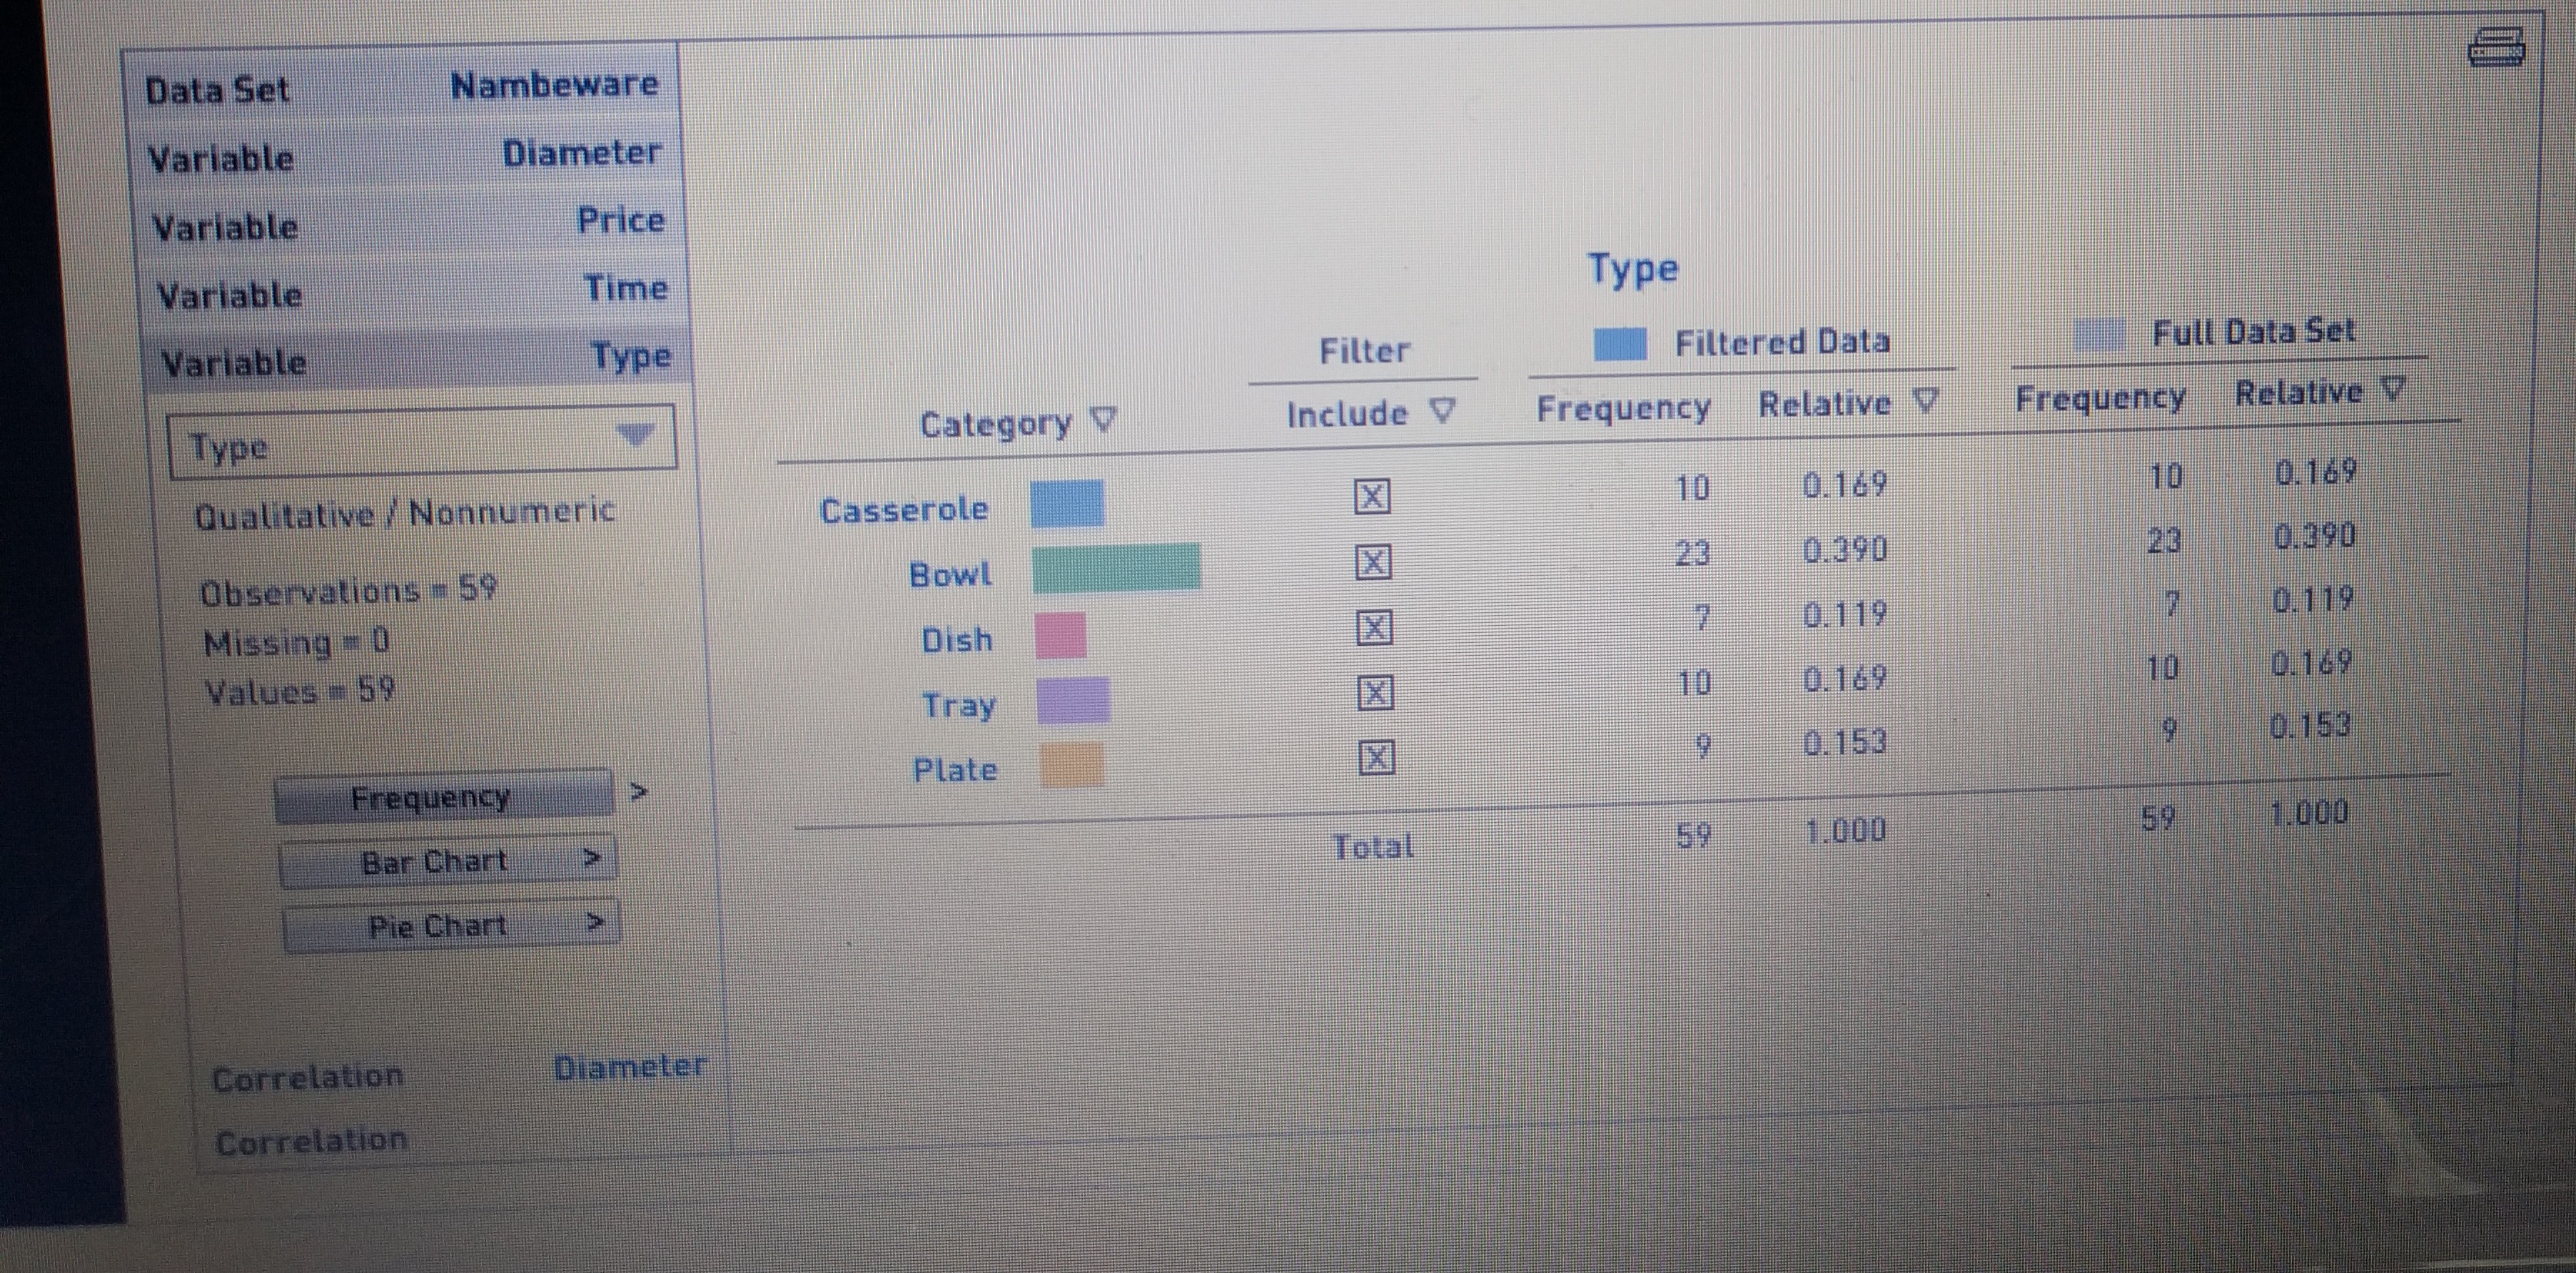
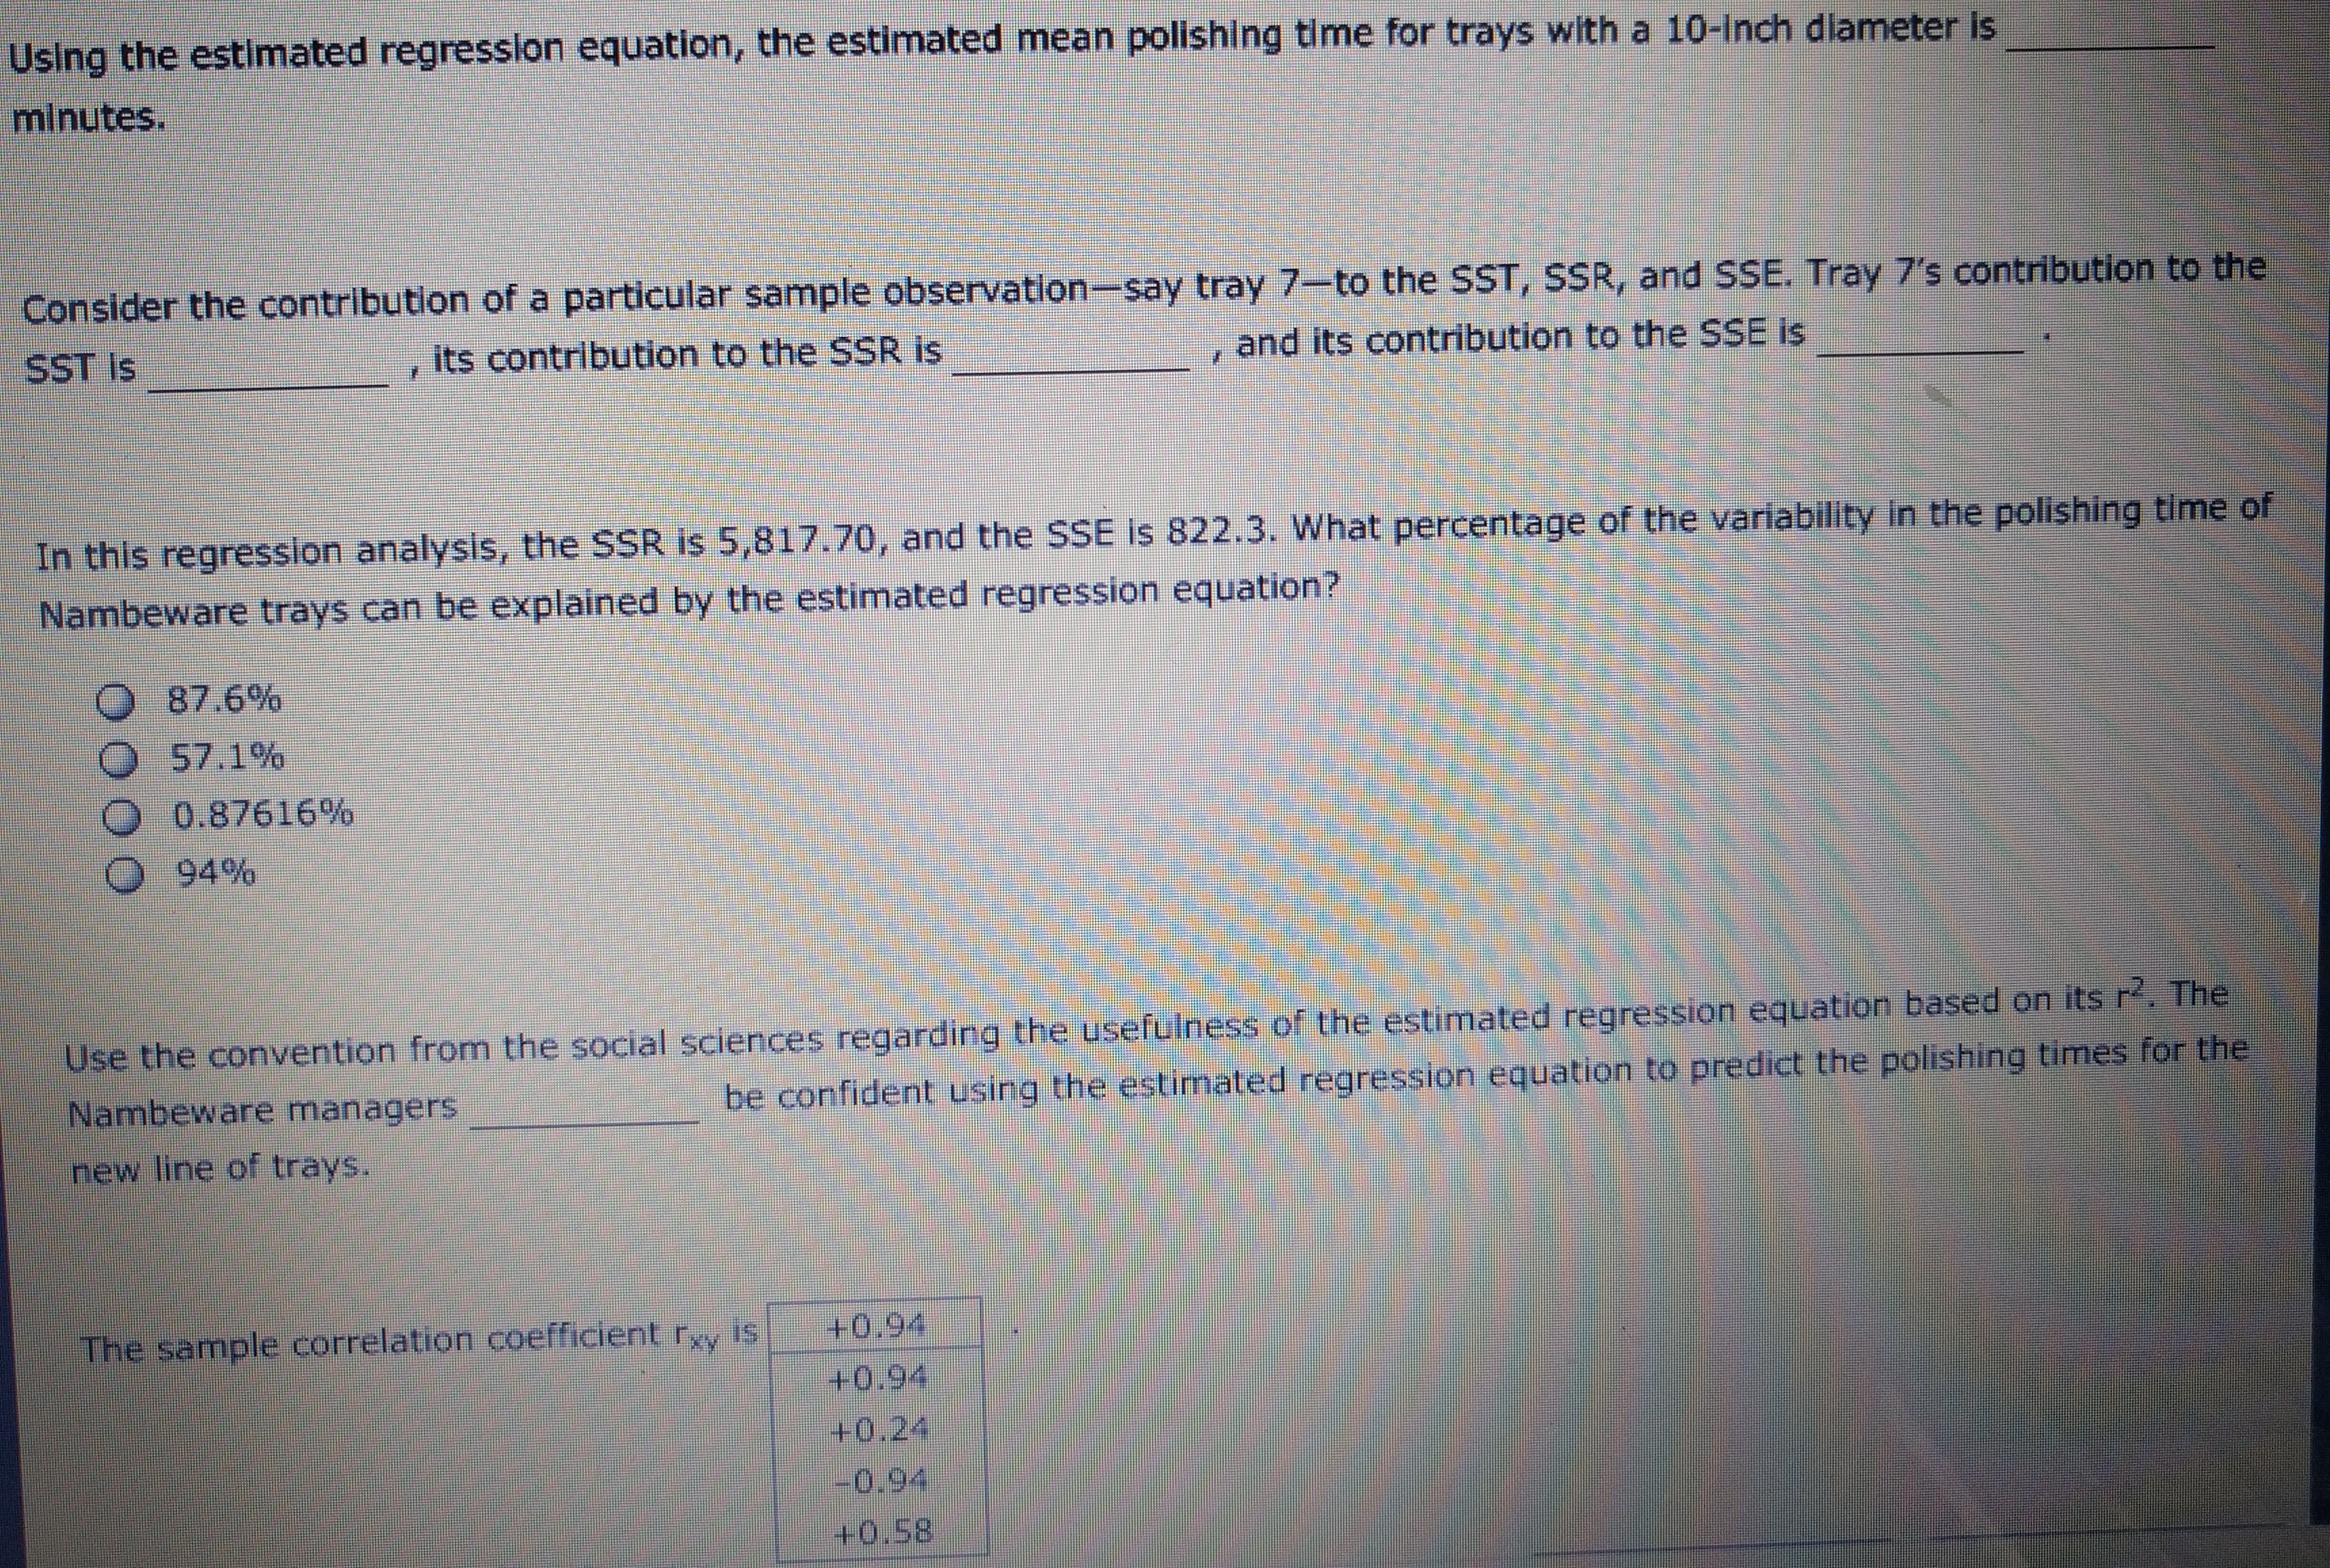
3. The coefficient of determination and the sample correlation coefficient Aa Aa Nambe manufactures a line of metal tableware called Nambeware. A piece of Nambeware is produced by sand-casting a special alloy of several metals. After casting, the piece goes through a series of shaping, grinding, buffing, and polishing steps. Nambe is analyzing how to adjust its production schedule to accommodate the polishing step of a new line of trays that it is adding to Its product line. Nambe selects a random sample of its tableware pieces and collects data on the type of piece (tray, dish, bowl, plate, or casserole), its diameter (in inches), its polishing time (in minutes), and its price (in dollars). [Source: Data and Story Library (DASL).] The sample data are located in the data set Nambeware. Use the DataView tool to answer the following questions. Data Set Nambeware Sample Variables = 4 Observations - 59 Random sample of Nambeware pieces Data and Story Library (DASLI Variables Observ Observations Variable Form ..Missing Values Me Type Nonnumeric Diameter Numeric TimeData Set Nambeware Nambeware S Sample Piece Type Diameter Time Price Variables - 4 V inches V minutes \\ dollars V Observations - 59 801 Bowl 8.0 34.88 69.00 B02 Bowl 10.4 17.67 54.00 B03 Bowl 7.4 16.41 39.00 Variables BO4 Bowl 5.4 12.02 29.50 Observations B05 Bowl 6.0 23.21 42.00 Bowl 9.0 20.64 65.00 807 Bowl 9.0 46.95 115.00 Bow! 7.5 20.21 36.50 BO9 Bowl 14.0 32.62 109.00 Variable Diameter 810 Bowl 7.0 17.84 45.00 01 1 Bowl 22.82 150.00 Variable Price 812 Bowl 12.0 29.48 39.00 Variable Time B13 Bowl 15.61 60.00 Variable Type Bowl 10.25 31.00 Correlation Diameter 815 Bowl 12.0 45.78 719.00 Correlation3. The coefficient of determination and the sample correlation coefficient As Aa Nambe manufactures a line of metal tableware called Nambeware. A piece of Nambeware is produced by sand-casting a special alloy of several metals. After casting, the piece goes through a series of shaping, grinding, buffing, and polishing steps. Nambe is analyzing how to adjust its production schedule to accommodate the polishing step of a new line of trays that it is adding to Its product line. Nambe selects a random sample of Its tableware pieces and collects data on the type of plece (tray, dish, bowl, plate, or casserole), Its diameter (in inches), its polishing time (in minutes), and its price (in dollars). [Source: Data and Story Library (DASL). ] The sample data are located in the data set Nambeware. Use the DataView tool to answer the following questions. Data Set Nambeware Nambeware Sample Piece Type Diameter Time Price Variables = 4 A inches V minutes v Observations - 59 P05 Plate 6.0 20.05 24.50 PO6 Plate 11.0 26.25 52.00 11.1 21.87 62.50 Variables 14.5 23.88 89.00 5.0 16.66 21.50 Observations 16.0 54.86 155.00 44.14 99.00 109.38 260.00 26.53 74.00 Variable Diameter 33.89 $4.30 165.00 Variable Price 189.00 Variable Time 75.00 Variable Type FEE .50 Correlatio DiameterData Set Nambeware Diameter in inches Variable Diameter Location Full Data Quartiles Full Data Diameter Minimum 5.0 01 8.0 Quantitative Median 11.0 Median 11.0 Observations - 59 Mean 10.9 03 13.0 Missing - 0 Maximum 25.0 Values - 59 Variability & Shape Deciles Statistics Values 59 10% 6.0 Range 20.0 20% 7.5 Histogram Interquartile Range 5.0 30% 9.0 Box Plots Standard Deviation 3.9 10.0 Coefficient of Variation 35% Median 11.0 Skewness 0.38 11.7 Variable Price 124 Variable Time Filters Include observations between... 14.0 15.4 Variable Type Minimum Correlation Diameter Maximum CorrelationData Set Nambeware Price in dollars Variable Diameter Price Location Full Data Quartiles Full Data Variable Minimum 21.50 01 45.00 Price Median 75.00 Median 75.00 Quantitative Mean 86.38 03 109.00 Observations - 59 Maximum 260.00 Missing = 0 Variability & Shape Deciles Values - 59 Values 59 10%% 30.00 Range 238.50 20% 42.00 Statistics Interquartile Range 64.00 30%% 52.50 Histogram Standard Deviation 51.57 40% $5.00 Box Plots Coefficient of Variation Median 75.00 Skewness 1.21 60 7 93.00 70 99.00 Variable Time Filter: Include observations between... 80% 115.00 165.00 Variable Type Minimum Go Correlation Diameter Maximum CorrelationData Set Nambeware Time in minutes Variable Diameter Quartiles Full Data Variable Location Full Data Price Variable Time Minimum 12.02 01 21.87 Median 31.46 Median 31.46 Time Mean 35.82 03 45.12 Quantitative Maximum 109.38 Observations - 59 Variability & Shape Deciles Missing - 0 Values 59 10% 17.46 Values - 59 Range 07.36 20% 20.85 Interquartile Range 23.25 30% 23.21 Statistics Standard Deviation 19.02 26.52 Histogram Coefficient of Variation 53% Median 31.46 Box Plots Skewness 1.58 23.89 44. 14 Filters Include observations between... 48.74 83.13 Variable Type Minimum Correlation Diameter Maximum Go CorrelationData Set Nambeware Variable Diameter Variable Price Variable Time Type Variable Type Filter Filtered Data Full Data Set Type Category Include Frequency Relative V Frequency Relative V Qualitative / Nonnumeric Casserole X 10 0.169 10 0. 169 Observations - 59 Bowl X 23 0.390 23 0.390 Missing = 0 Dish X 0. 119 0.119 Values - 59 Tray X 10 0.169 10 0.169 Frequency Plate X 0.153 0.153 Bar Chart Total 59 1.000 59 1.000 Pie Chart Correlation Diameter CorrelationUsing the estimated regression equation, the estimated mean polishing time for trays with a 10-inch diameter is minutes. Consider the contribution of a particular sample observation-say tray 7-to the SST, SSR, and SSE. Tray 7's contribution to the SST Is , its contribution to the SSR is , and its contribution to the SSE is In this regression analysis, the SSR is 5,817.70, and the SSE is 822.3. What percentage of the variability in the polishing time of Nambeware trays can be explained by the estimated regression equation? O 57.1% 0.87616% 94% Use the convention from the social sciences regarding the usefulness of the estimated regression equation based on its ro. The Nambeware managers be confident using the estimated regression equation to predict the polishing times for the new line of trays. The sample correlation coefficient rxy is +0.94 +0.94 +0.24 -0.94 +0.58Let u equal the mean polishing time of the population of Nambeware trays. The point estimate of p Is minutes. Hint: The data contained in the DataView tool includes five different types of Nambeware. To filter the data In order to display the data for the pieces in the sample that are trays only, click on a Variable sliding panel on the bottom left of the tool and from the dropdown menu, select Type. In the Filter column, uncheck all the types except Tray. Check that the bottom of the tool display shows Filter: Type = Tray. Then click another Variable sliding panel and from the dropdown menu, select Time. Statistics for the Nambeware pieces that are trays are now shown on the tool display in the column labeled "Filtered." Now consider a particular tray in the sample, say, tray 7. Tray 7 is identified as TO7 in the column labeled Piece in the tool's Observation view. The error involved in using the point estimate of u as the polishing time for tray 7 is minutes. Hint: To see individual observations, click on Data Set in the top left side of the tool, click on Data Set. Then click on the Observations button to switch from Variables view to Observations view.) Nambe uses the 10 pieces in its sample that are trays to estimate the simple linear regression model that predicts the polishing time from the tray's diameter: Bo + Bix + E. where y - polishing time of a tray (in minutes) and - the tray's diameter ( in inches) The estimated regression equation is y - -13.99 42 Using the estimated regression equation, the estimated mear pol ishir .0-inch diameter is minutes. Consider the contribution of SSE. Tray 7's contribution to the
Step by Step Solution
There are 3 Steps involved in it

Get step-by-step solutions from verified subject matter experts