

Question: 3. The data in the table below are chemical process yield readings on successive days (read down, then across). Process Yield 87.3 84.1 90.1 95.2
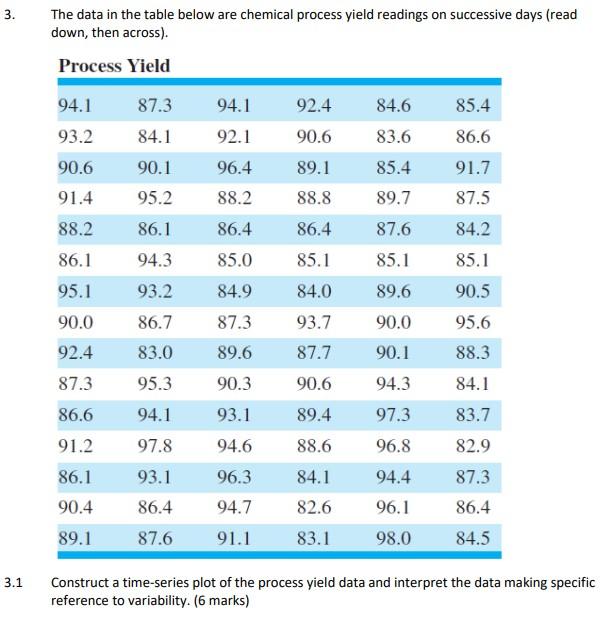
3. The data in the table below are chemical process yield readings on successive days (read down, then across). Process Yield 87.3 84.1 90.1 95.2 92.4 90.6 89.1 84.6 83.6 85.4 89.7 88.8 86.1 86.4 87.6 85.1 94.1 93.2 90.6 91.4 88.2 86.1 95.1 90.0 92.4 87.3 86.6 91.2 86.1 90.4 89.1 85.4 86.6 91.7 87.5 84.2 85.1 90.5 95.6 88.3 85.1 94.1 92.1 96.4 88.2 86.4 85.0 84.9 87.3 89.6 90.3 93.1 94.6 96.3 94.7 94.3 93.2 86.7 83.0 95.3 94.1 97.8 93.1 86.4 87.6 84.0 93.7 87.7 89.6 90.0 90.1 94.3 97.3 90.6 89.4 84.1 83.7 88.6 96.8 82.9 84.1 82.6 94.4 96.1 98.0 87.3 86.4 84.5 91.1 83.1 3.1 Construct a time-series plot of the process yield data and interpret the data making specific reference to variability. (6 marks)
Step by Step Solution
There are 3 Steps involved in it

Get step-by-step solutions from verified subject matter experts