

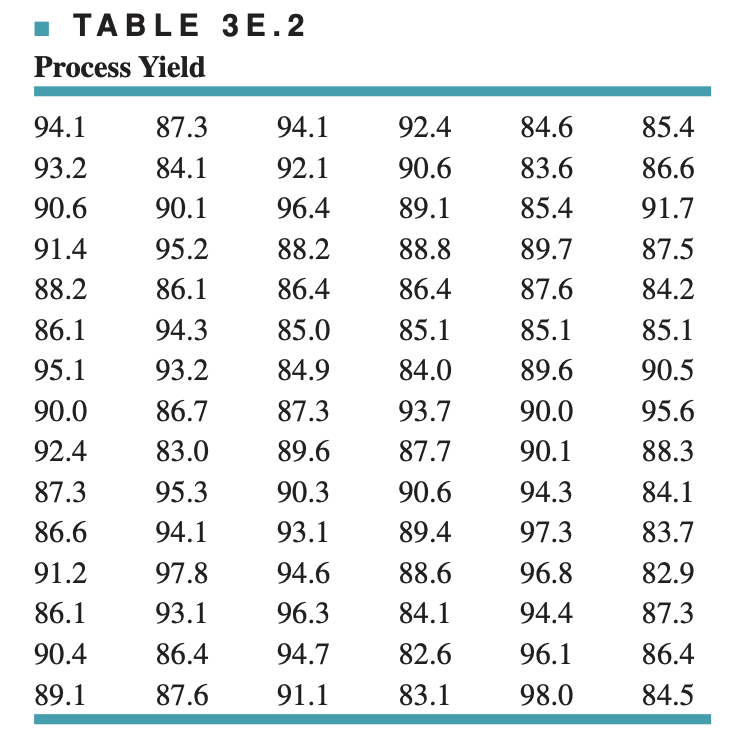
Question: 3.7. The data shown in Table 3E.2 are chemical process yield readings on successive days (read down, then across). Construct a histogram for these data.
3.7. The data shown in Table 3E.2 are chemical process yield readings on successive days (read down, then across). Construct a histogram for these data. Comment on the shape of the histogram. Does it resemble any of the distributions that we have discussed in this chapter?
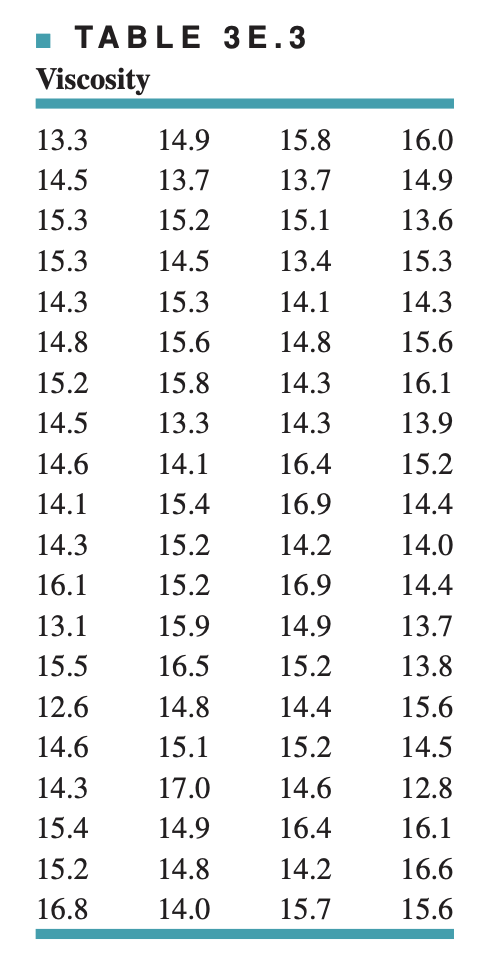
3.8. An article in Quality Engineering (Vol. 4, 1992, pp. 487495) presents viscosity data from a batch chemical process. A sample of these data is presented in Table 3E.3 (read down, then across). (a) Construct a stem-and-leaf display for the viscosity data. (b) Construct a frequency distribution and histogram. (c) Convert the stem-and-leaf plot in part (a) into an ordered stem-and-leaf plot. Use this graph to assist in locating the median and the upper and lower quartiles of the viscosity data. (d) What are the ninetieth and tenth percentiles of viscosity?
Step by Step Solution
There are 3 Steps involved in it

Get step-by-step solutions from verified subject matter experts