

Question: 3. The following data table shows the eruption-duration and the interval between the erup- tions of Old Faithful Geyser in minutes, measured by a visitor
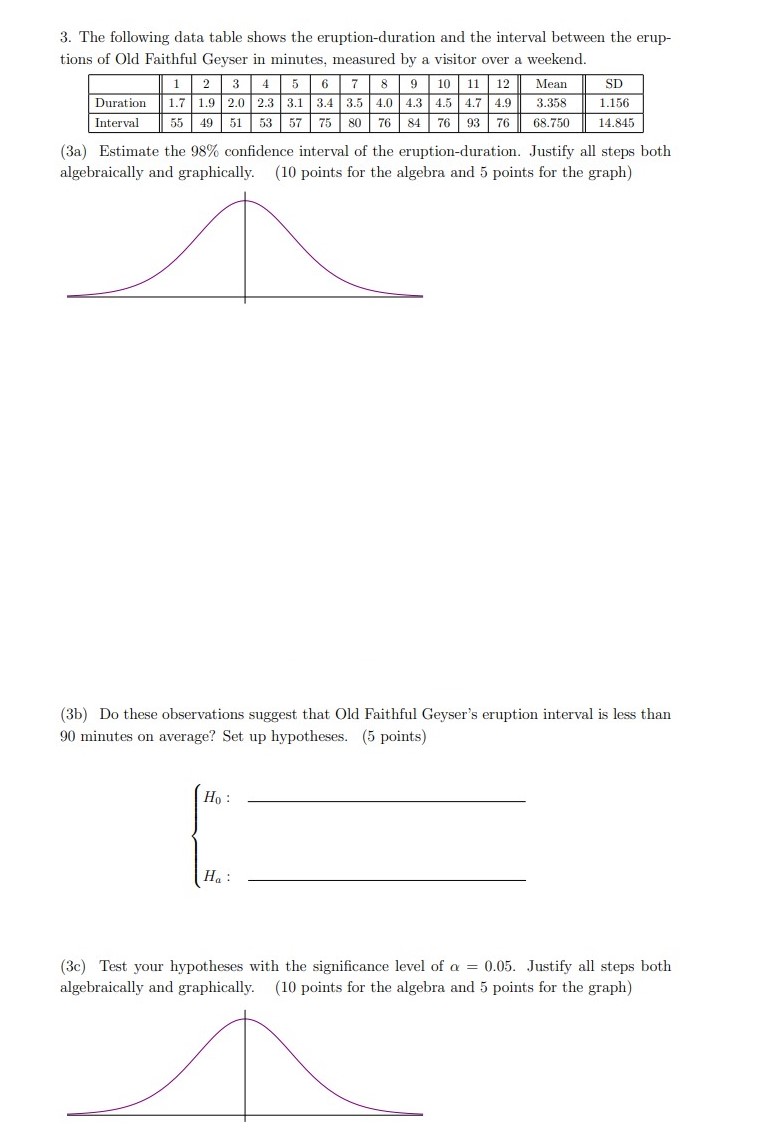
3. The following data table shows the eruption-duration and the interval between the erup- tions of Old Faithful Geyser in minutes, measured by a visitor over a weekend 2 3 4 5 6 7 8 9 10 11 12 Mean SD Duration 1.7 1.9 2.0 2.3 3.1 3.4 3.5 4.0 4.3 4.5 4.7 4.9 3.358 1.156 Interval 55 49 51 53 57 75 80 76 84 76 93 76 68.750 14.845 (3a) Estimate the 98% confidence interval of the eruption-duration. Justify all steps both algebraically and graphically. (10 points for the algebra and 5 points for the graph) (3b) Do these observations suggest that Old Faithful Geyser's eruption interval is less than 90 minutes on average? Set up hypotheses. (5 points) Ho : Ha : (3c) Test your hypotheses with the significance level of a = 0.05. Justify all steps both algebraically and graphically. (10 points for the algebra and 5 points for the graph)
Step by Step Solution
There are 3 Steps involved in it

Get step-by-step solutions from verified subject matter experts